NVIDIA's price has been confined within a well-defined ascending channel, with its upward trajectory governed by a diagonal support trendline and its upside limited by a confluence of resistance. The stock's recent attempts to advance have been definitively rejected by this overhead resistance zone, signaling a lack of sufficient buying pressure at current price levels.
The Trading Hypothesis
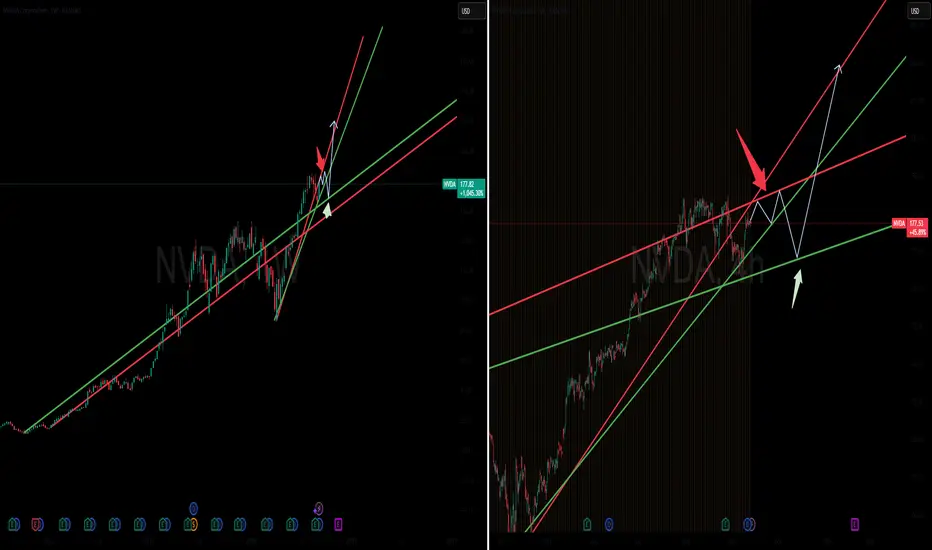
The primary thesis is that the price will re-engage with and test the strength of the lower diagonal support trendline one final time. The failure to decisively break the dual overhead resistance marks a key moment, suggesting that a retracement is necessary to reset market conditions and establish a more stable foundation for a future rally.
This projected move involves a retracement back to the lower boundary of the existing channel. The price action here will be critical. Should this diagonal support fail to hold—a high-probability scenario given the recent rejections at resistance—it would trigger a breakdown of the prevailing uptrend.
This breakdown would likely initiate a more substantial corrective wave, driving the price toward the next major horizontal support level. This lower support line, identified on the chart, represents a key demand zone where new long-term buyers may step in, providing the necessary liquidity to halt the decline and potentially form a new base.
Entry Point: The Red Arrow
The red arrow on the chart signifies the optimal entry point for initiating a short position.
Exit Point: The Green Arrow
The green arrow marks the strategic exit point for the short position. This level is defined by the next major horizontal support line
The Trading Hypothesis
The primary thesis is that the price will re-engage with and test the strength of the lower diagonal support trendline one final time. The failure to decisively break the dual overhead resistance marks a key moment, suggesting that a retracement is necessary to reset market conditions and establish a more stable foundation for a future rally.
This projected move involves a retracement back to the lower boundary of the existing channel. The price action here will be critical. Should this diagonal support fail to hold—a high-probability scenario given the recent rejections at resistance—it would trigger a breakdown of the prevailing uptrend.
This breakdown would likely initiate a more substantial corrective wave, driving the price toward the next major horizontal support level. This lower support line, identified on the chart, represents a key demand zone where new long-term buyers may step in, providing the necessary liquidity to halt the decline and potentially form a new base.
Entry Point: The Red Arrow
The red arrow on the chart signifies the optimal entry point for initiating a short position.
Exit Point: The Green Arrow
The green arrow marks the strategic exit point for the short position. This level is defined by the next major horizontal support line
GoldenTraders is a premier trading community dedicated to helping you navigate the complexities of the financial markets with confidence and clarity.
Please join for more trade Ideas.
GoldenTraders: discord.gg/nrCvUT8yzt
Please join for more trade Ideas.
GoldenTraders: discord.gg/nrCvUT8yzt
免责声明
The information and publications are not meant to be, and do not constitute, financial, investment, trading, or other types of advice or recommendations supplied or endorsed by TradingView. Read more in the Terms of Use.