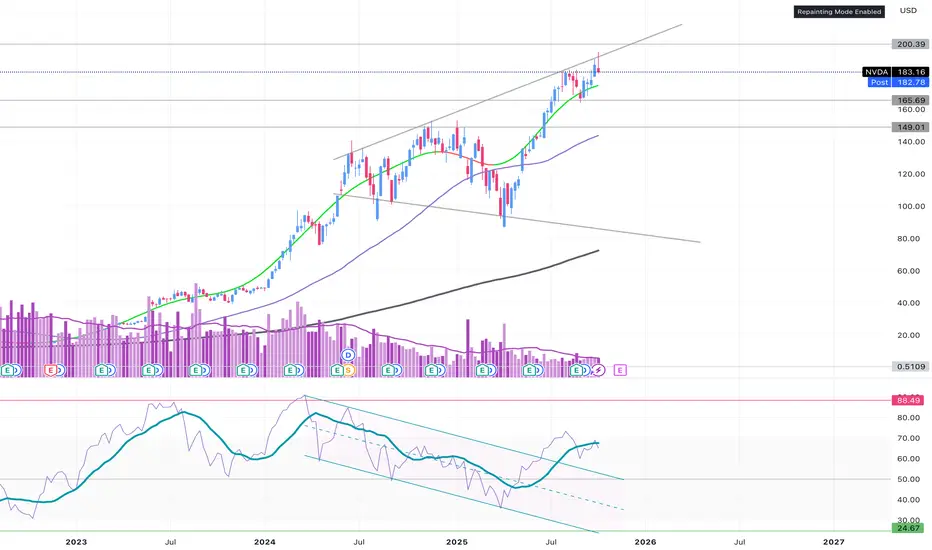
MOMENTUM - daily is in uptrend channel; weekly is ??; monthly looks toppy
VOLUME - some increased volume on the breakout above 183; Overall, volume not significantly changed since the April bottom
PRICE - There is a topping candle on the weekly at the upper trendline of the megaphone; Price reached 195 before reversing back down
What does it all mean?
1. Possible revisit 165
2. Possible revisit 150
3. Possible retouch of 180 and then next move up again
3. Long-term top is in with uncertain future
Let me know what you think….
免责声明
这些信息和出版物并不意味着也不构成TradingView提供或认可的金融、投资、交易或其它类型的建议或背书。请在使用条款阅读更多信息。