NVDA Option Income Strategy ETF (NVDY) – Daily & Weekly TA Break
Been watching  NVDY closely — wanted to share some confluence I found between the daily and weekly charts.
🪜 Weekly Chart Breakdown
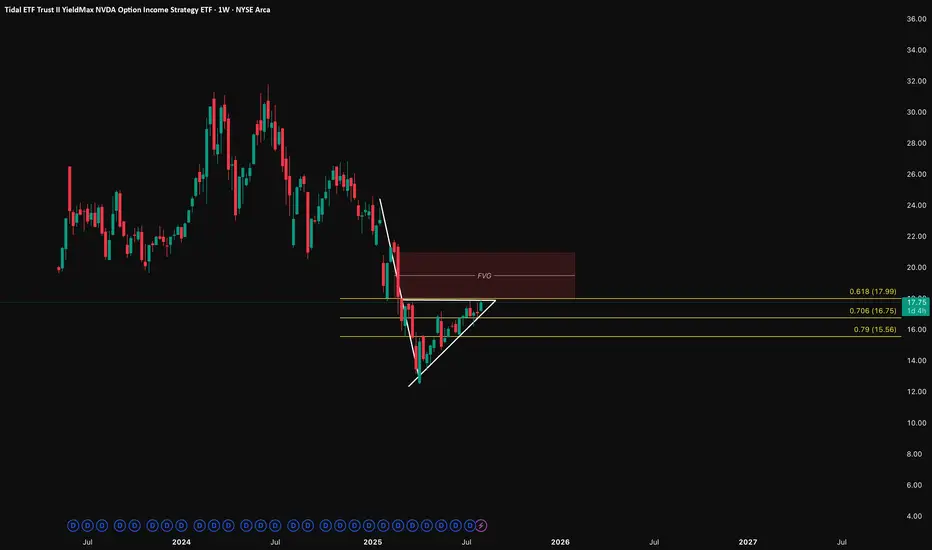
Zoomed out, drew fibs on the big swing — top to bottom. Here’s where we’re cooking:
• 0.618 at 17.99
• 0.706 at 16.75
• 0.79 at 15.56
We’re dancing right at that golden pocket, and there’s a nasty little FVG above just waiting to get filled. This thing dumped hard, and now it’s walking its way back up like it remembered it had bills to pay.
🕵️♂️ Daily Chart Breakdown
Caught a tight ascending triangle pressing up into that 0.618 level.
Price is respecting both trendline and resistance like it’s trying to decide if it’s ready to throw hands or fold.
• Higher lows stacking like bricks.
• Resistance is flatlined right under $18.
• Volume’s low but steady — pressure’s building.
⚔️ What I’m Watching
• Breakout above $18 with volume? We could rip into that FVG like butter. Eyes on $20–21 for potential fill.
• Rejection at the top? I’m not crying — I’ll catch it at $16.75 or $15.56. That’s where the fib gods are lurking.
Final Word
I ain’t trying to overcomplicate this — the levels are speaking loud.
Weekly gave me the roadmap, daily gave me the ignition.
Watching close. This one’s either a send or a snipe.
Let me know if y’all see it the same or if I missed something.
🪜 Weekly Chart Breakdown
Zoomed out, drew fibs on the big swing — top to bottom. Here’s where we’re cooking:
• 0.618 at 17.99
• 0.706 at 16.75
• 0.79 at 15.56
We’re dancing right at that golden pocket, and there’s a nasty little FVG above just waiting to get filled. This thing dumped hard, and now it’s walking its way back up like it remembered it had bills to pay.
🕵️♂️ Daily Chart Breakdown
Caught a tight ascending triangle pressing up into that 0.618 level.
Price is respecting both trendline and resistance like it’s trying to decide if it’s ready to throw hands or fold.
• Higher lows stacking like bricks.
• Resistance is flatlined right under $18.
• Volume’s low but steady — pressure’s building.
⚔️ What I’m Watching
• Breakout above $18 with volume? We could rip into that FVG like butter. Eyes on $20–21 for potential fill.
• Rejection at the top? I’m not crying — I’ll catch it at $16.75 or $15.56. That’s where the fib gods are lurking.
Final Word
I ain’t trying to overcomplicate this — the levels are speaking loud.
Weekly gave me the roadmap, daily gave me the ignition.
Watching close. This one’s either a send or a snipe.
Let me know if y’all see it the same or if I missed something.
免责声明
这些信息和出版物并不意味着也不构成TradingView提供或认可的金融、投资、交易或其它类型的建议或背书。请在使用条款阅读更多信息。
免责声明
这些信息和出版物并不意味着也不构成TradingView提供或认可的金融、投资、交易或其它类型的建议或背书。请在使用条款阅读更多信息。