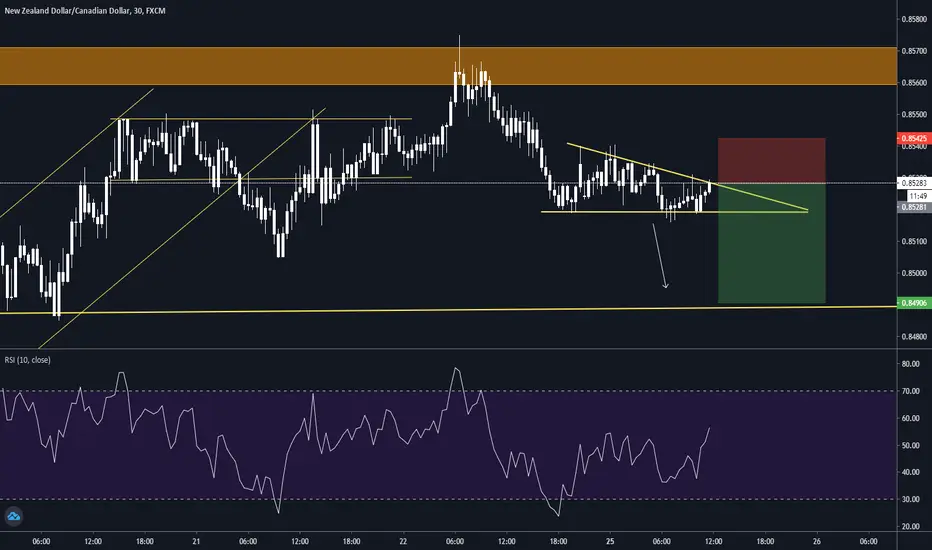
Below is a good example of the descending triangle pattern appearing on NZD/CAD. A downtrend leads into the consolidation period where sellers outweigh buyers and slowly push price lower. A strong break of the lower trendline presents traders with an opportunity to go short. In this example, it doesn’t take long for the position to move in the opposite direction, highlighting the importance of setting an appropriate stop level.
The take profit level is set using the vertical distance measured at the beginning of the descending triangle formation.
The take profit level is set using the vertical distance measured at the beginning of the descending triangle formation.
免责声明
这些信息和出版物并非旨在提供,也不构成TradingView提供或认可的任何形式的财务、投资、交易或其他类型的建议或推荐。请阅读使用条款了解更多信息。
免责声明
这些信息和出版物并非旨在提供,也不构成TradingView提供或认可的任何形式的财务、投资、交易或其他类型的建议或推荐。请阅读使用条款了解更多信息。