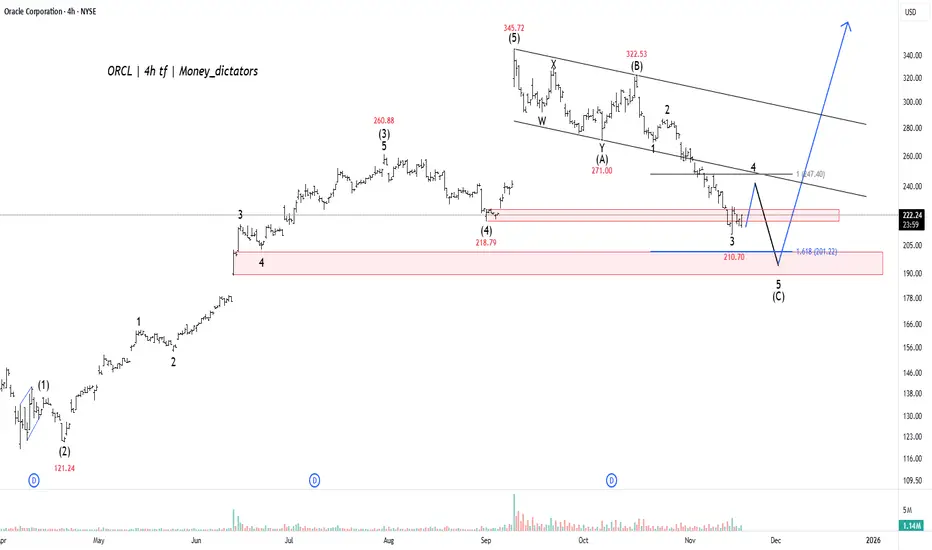
Wave Projection of Oracle (ORCL) suggests the stock is currently in the final stages of a major correction, specifically concluding the last downward leg, wave (C), of a larger pullback. The chart indicates that after a temporary bounce, the price is expected to make one final, sharp drop to complete this corrective phase. This action is essential for the market to "reset" before the next significant rally.
The critical support area for the end of this correction is identified in a tight range between $207.72 (the $1.618$ Fibonacci extension) and the immediate low of $210.70. This zone offers strong confluence with previous structural support, making it the highest probability area for the market to find a decisive bottom. The analysis projects that the current selling pressure will exhaust itself within this $207-$211 range.
Once the price successfully reaches and holds this projected support zone, the analysis anticipates the launch of a major, long-term bullish impulse wave, likely the start of the final wave (5) of a large-scale uptrend. This new wave is expected to drive the stock significantly higher, with a target to surpass the previous all-time high of $345.77. This pattern suggests that the current decline should be viewed as a final buying opportunity before a powerful upward trend begins.
To eliminate these delays and give priority access to serious traders, we’ve launched an exclusive Premium EDU + Wave Count Group.
💰 Annual Fee: $115
BUY NOW: t.me/moneydictators/148
Lifetime Free - t.me/moneydictators
💰 Annual Fee: $115
BUY NOW: t.me/moneydictators/148
Lifetime Free - t.me/moneydictators
相关出版物
免责声明
这些信息和出版物并非旨在提供,也不构成TradingView提供或认可的任何形式的财务、投资、交易或其他类型的建议或推荐。请阅读使用条款了解更多信息。