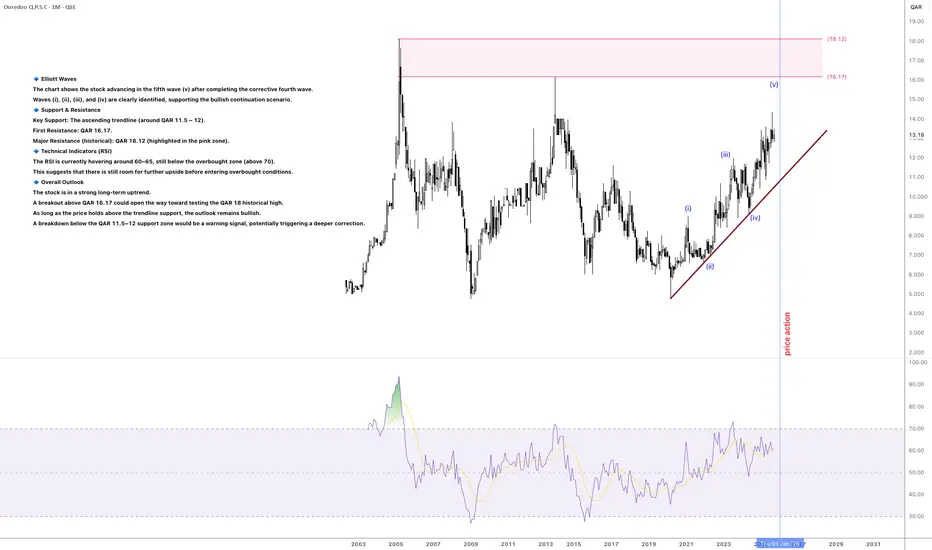
🔹 Elliott Waves
The chart shows the stock advancing in the fifth wave (v) after completing the corrective fourth wave.
Waves (i), (ii), (iii), and (iv) are clearly identified, supporting the bullish continuation scenario.
🔹 Support & Resistance
Key Support: The ascending trendline (around QAR 11.5 – 12).
First Resistance: QAR 16.17.
Major Resistance (historical): QAR 18.12 (highlighted in the pink zone).
🔹 Technical Indicators (RSI)
The RSI is currently hovering around 60–65, still below the overbought zone (above 70).
This suggests that there is still room for further upside before entering overbought conditions.
🔹 Overall Outlook
The stock is in a strong long-term uptrend.
A breakout above QAR 16.17 could open the way toward testing the QAR 18 historical high.
As long as the price holds above the trendline support, the outlook remains bullish.
A breakdown below the QAR 11.5–12 support zone would be a warning signal, potentially triggering a deeper correction.
免责声明
这些信息和出版物并非旨在提供,也不构成TradingView提供或认可的任何形式的财务、投资、交易或其他类型的建议或推荐。请阅读使用条款了解更多信息。