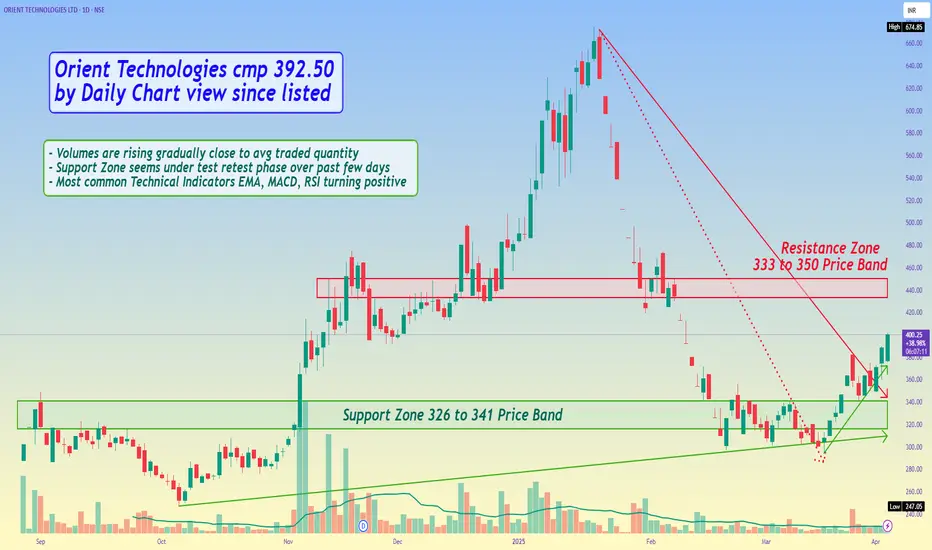
Orient Technologies cmp 392.50 by Daily Chart view since listed
- Support Zone 326 to 341 Price Band
- Resistance Zone 333 to 350 Price Band
- Volumes are rising gradually close to avg traded quantity
- Support Zone seems under test retest phase over past few days
- Most common Technical Indicators EMA, MACD, RSI turning positive
- Price sustaining above Falling Resistance Trendline and Rising Support Trendline
注释
Ooops My Bad.... Please read the Resistance Zone as 433 to 450 Price Band 免责声明
这些信息和出版物并非旨在提供,也不构成TradingView提供或认可的任何形式的财务、投资、交易或其他类型的建议或推荐。请阅读使用条款了解更多信息。
免责声明
这些信息和出版物并非旨在提供,也不构成TradingView提供或认可的任何形式的财务、投资、交易或其他类型的建议或推荐。请阅读使用条款了解更多信息。