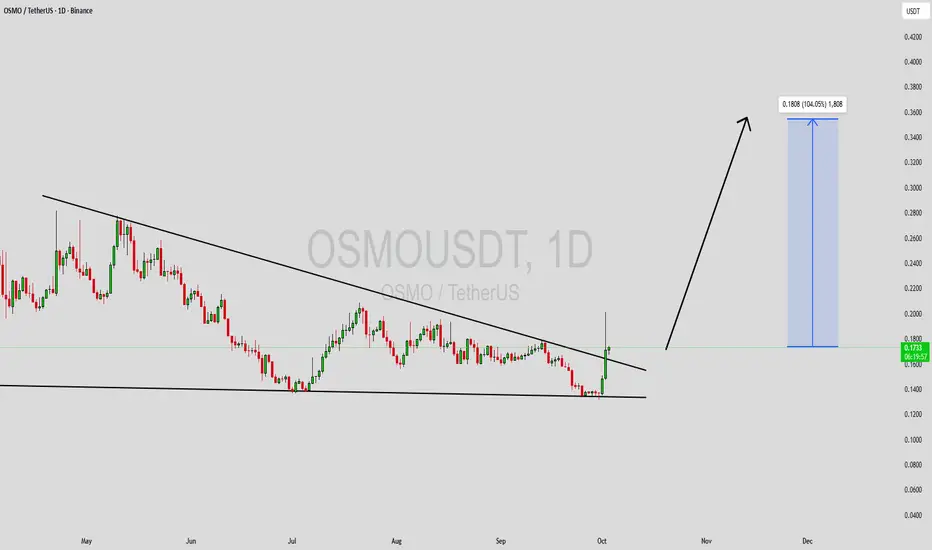
OSMOUSDT is showing a classic falling wedge pattern on the chart, which is widely considered a bullish reversal setup in technical analysis. This pattern often signals the end of a downtrend and the beginning of a potential breakout rally. With strong trading volume supporting the structure, OSMO has caught the attention of investors who are anticipating significant upside momentum in the coming sessions.
The falling wedge breakout scenario aligns well with current market dynamics, where OSMO has been consolidating at lower levels and building buying pressure. A confirmed breakout from this wedge could trigger a strong move to the upside, with expectations pointing toward a gain of 90% to 100%+. This makes OSMOUSDT an attractive pair for traders looking for high-reward opportunities.
Investor interest in OSMO is steadily growing, adding fuel to the bullish outlook. If the current volume levels sustain, the price action could accelerate quickly, targeting higher resistance zones with strong momentum. The key factor will be whether the breakout can hold above its support levels and attract further institutional and retail participation.
✅ Show your support by hitting the like button and
✅ Leaving a comment below! (What is You opinion about this Coin)
Your feedback and engagement keep me inspired to share more insightful market analysis with you!
免责声明
The information and publications are not meant to be, and do not constitute, financial, investment, trading, or other types of advice or recommendations supplied or endorsed by TradingView. Read more in the Terms of Use.
免责声明
The information and publications are not meant to be, and do not constitute, financial, investment, trading, or other types of advice or recommendations supplied or endorsed by TradingView. Read more in the Terms of Use.