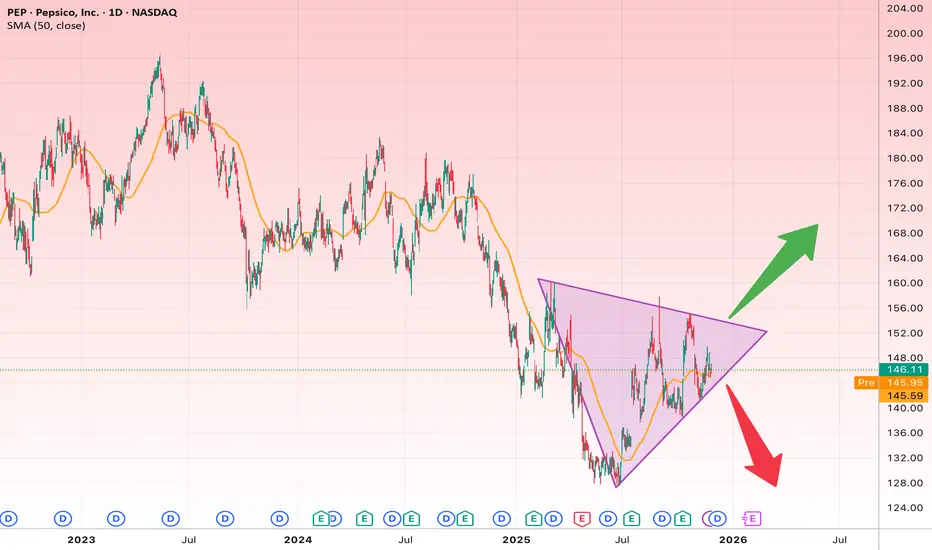
The PEP daily chart is forming a symmetrical triangle, a classic consolidation pattern that often leads to a strong breakout. Price has been bouncing between the upper and lower trendlines and is now positioned around the middle of the structure.
Bullish Scenario
If the price breaks above the upper trendline around $150–$152, a bullish continuation is likely.
Bullish Targets:
• Target 1: $160
• Target 2: $168
• Target 3: Up to $175 if momentum is strong
Bearish Scenario
Breaking below the lower triangle boundary (~$142) could trigger a deeper decline.
Bearish Targets:
• Target 1: $136
• Target 2: $130
Stop Loss
• For long positions: Below $142
• For short positions: Above $152
免责声明
这些信息和出版物并非旨在提供,也不构成TradingView提供或认可的任何形式的财务、投资、交易或其他类型的建议或推荐。请阅读使用条款了解更多信息。
免责声明
这些信息和出版物并非旨在提供,也不构成TradingView提供或认可的任何形式的财务、投资、交易或其他类型的建议或推荐。请阅读使用条款了解更多信息。