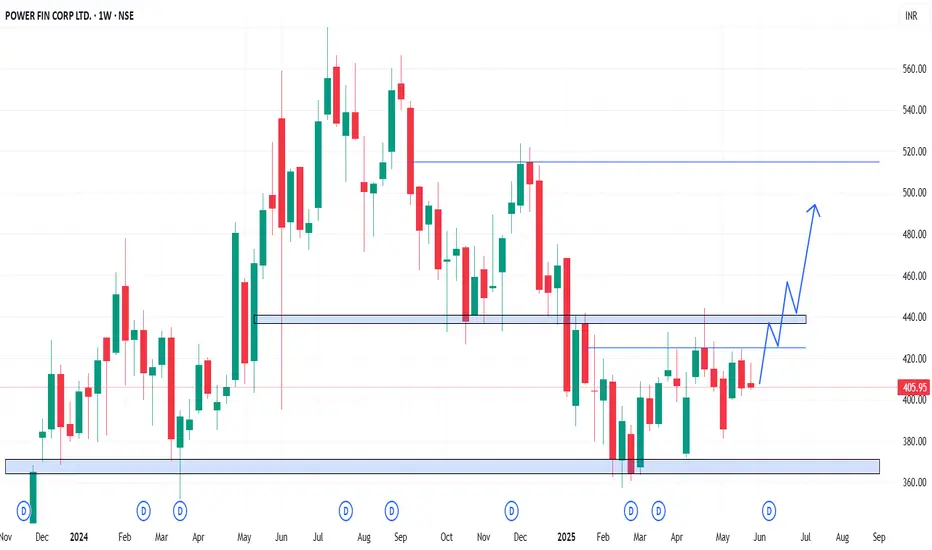
In the Weekly Chart of PFC ,
we can see that; 420-425 levels has shown strong rejection but selling has not been strong as per rejection.
Above 420 it ill bullish till 520 levels.
Trade as per your and Analysis
Expected momentum is shown in chart.
we can see that; 420-425 levels has shown strong rejection but selling has not been strong as per rejection.
Above 420 it ill bullish till 520 levels.
Trade as per your and Analysis
Expected momentum is shown in chart.
免责声明
这些信息和出版物并不意味着也不构成TradingView提供或认可的金融、投资、交易或其它类型的建议或背书。请在使用条款阅读更多信息。
免责声明
这些信息和出版物并不意味着也不构成TradingView提供或认可的金融、投资、交易或其它类型的建议或背书。请在使用条款阅读更多信息。