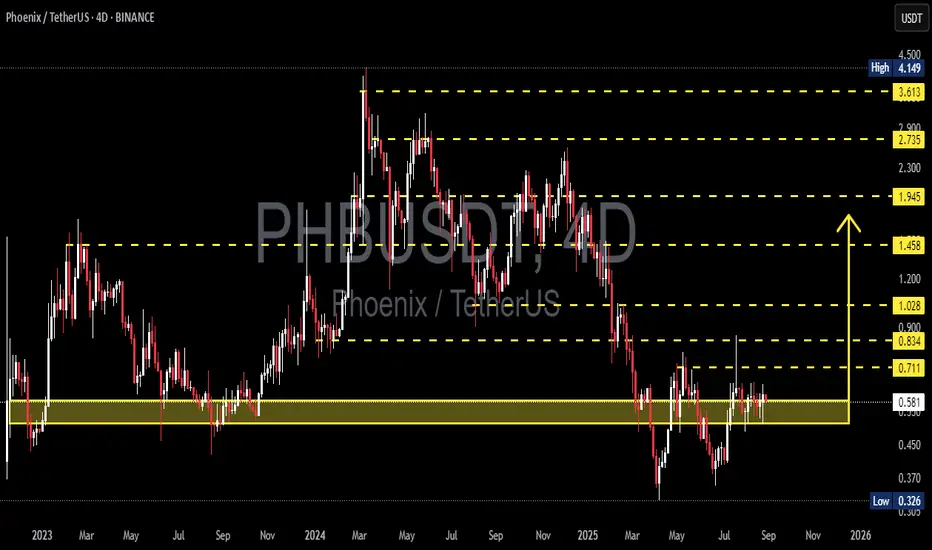
Currently, PHB/USDT is consolidating within a critical demand zone at 0.52 – 0.62. This area has repeatedly acted as a strong floor since 2023, absorbing heavy sell-offs and showing signs of accumulation.
The market structure suggests that PHB is forming a range-base accumulation pattern, with 0.711 as the immediate breakout trigger. The next move will decide whether PHB transitions into a bullish expansion or breaks down into deeper bearish territory.
---
🔹 Structure & Price Pattern
Demand zone (0.52 – 0.62): A key support level where buyers continue to defend strongly.
Cluster highs near 0.711: A liquidity level and breakout confirmation point.
Layered resistances above: 0.834 → 1.028 → 1.458 → 1.945, serving as potential take-profit zones.
Deep wicks to 0.326 in the past: Indicate capitulation events, followed by strong reclaim — a bullish sign as long as demand holds.
---
🟢 Bullish Scenario
If PHB closes above 0.711 (4D candle) with volume confirmation, a breakout rally may follow.
Upside targets:
1. 0.834 (minor resistance)
2. 1.028 (psychological resistance)
3. 1.458 (major resistance, strong take-profit area)
A confirmed breakout signals the end of long consolidation and a possible start of a bullish phase.
---
🔴 Bearish Scenario
Failure to break 0.60–0.62 / 0.711 may push PHB back toward 0.55 – 0.52.
If 0.52 breaks on a 4D close, PHB risks a deeper drop toward:
1. 0.50
2. 0.45
3. 0.37 – 0.326 (historical low)
A breakdown below 0.52 would confirm that buyers lost control, re-opening a bearish trend.
---
📌 Trading Strategy & Risk Management
Swing traders: Consider long entries near 0.55–0.58 with targets at 0.711+.
Breakout traders: Wait for a confirmed close above 0.711 before entering, targeting resistances above.
Stop loss: Below 0.52 to protect against deeper downside.
Maintain a Risk:Reward ratio ≥ 1:2 and use 4D candle closes for confirmation to avoid fakeouts.
---
✨ Conclusion
PHB is at a make-or-break level:
Holding above 0.52–0.62 keeps bullish momentum alive, with breakout potential toward 0.834–1.458.
Losing this demand zone could open the path back to 0.37–0.326 lows.
This is a critical crossroads — a breakout could mark the start of a new bullish cycle, while a breakdown signals renewed weakness.
#PHBUSDT #PHB #Phoenix #CryptoAnalysis #PriceAction #AltcoinAnalysis #CryptoTrading #SupportResistance #DemandZone #Breakout #BullishScenario #BearishScenario #SwingTrading
✅ Get Free Signals! Join Our Telegram Channel Here: t.me/TheCryptoNuclear
✅ Twitter: twitter.com/crypto_nuclear
✅ Join Bybit : partner.bybit.com/b/nuclearvip
✅ Benefits : Lifetime Trading Fee Discount -50%
✅ Twitter: twitter.com/crypto_nuclear
✅ Join Bybit : partner.bybit.com/b/nuclearvip
✅ Benefits : Lifetime Trading Fee Discount -50%
免责声明
这些信息和出版物并不意味着也不构成TradingView提供或认可的金融、投资、交易或其它类型的建议或背书。请在使用条款阅读更多信息。