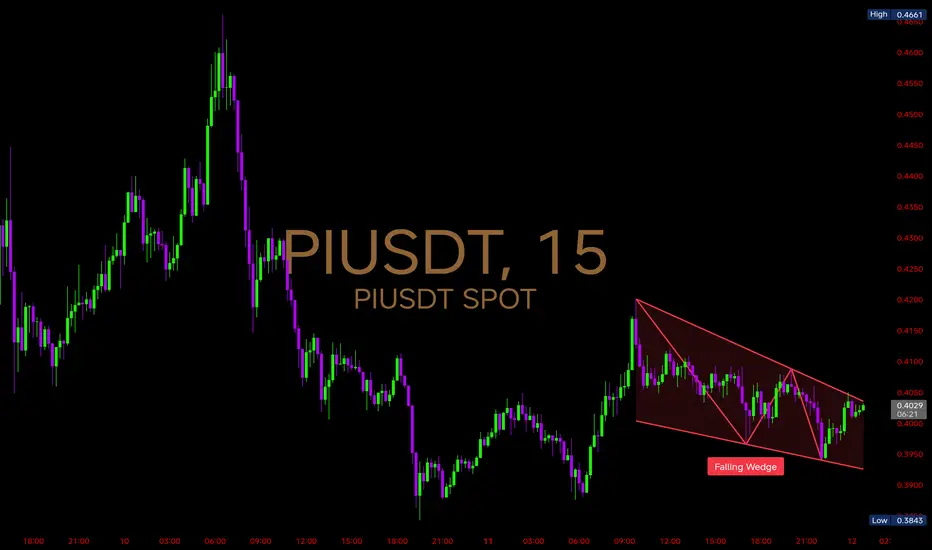
Price is currently trading inside a falling wedge — a pattern often seen as a bullish reversal setup when confirmed with a breakout.
🔍 Key Observations:
Price is compressing between lower highs & higher lows within the wedge
Current range: 0.3843 (low) to 0.4050 (upper wedge resistance)
Breakout confirmation would require a close above 0.4100, ideally with volume expansion
Support at 0.3950 remains key for wedge integrity — losing it could delay reversal potential
📈 Probable Scenarios:
Bullish Case: Breakout above 0.4100 triggers short-term relief rally, potentially retesting 0.4200 zone
Bearish Case: Breakdown below 0.3950 could invalidate wedge and resume the corrective leg
This wedge could mark the early signs of seller exhaustion. Watch for breakout confirmation before anticipating stronger upside momentum.
免责声明
这些信息和出版物并非旨在提供,也不构成TradingView提供或认可的任何形式的财务、投资、交易或其他类型的建议或推荐。请阅读使用条款了解更多信息。
免责声明
这些信息和出版物并非旨在提供,也不构成TradingView提供或认可的任何形式的财务、投资、交易或其他类型的建议或推荐。请阅读使用条款了解更多信息。