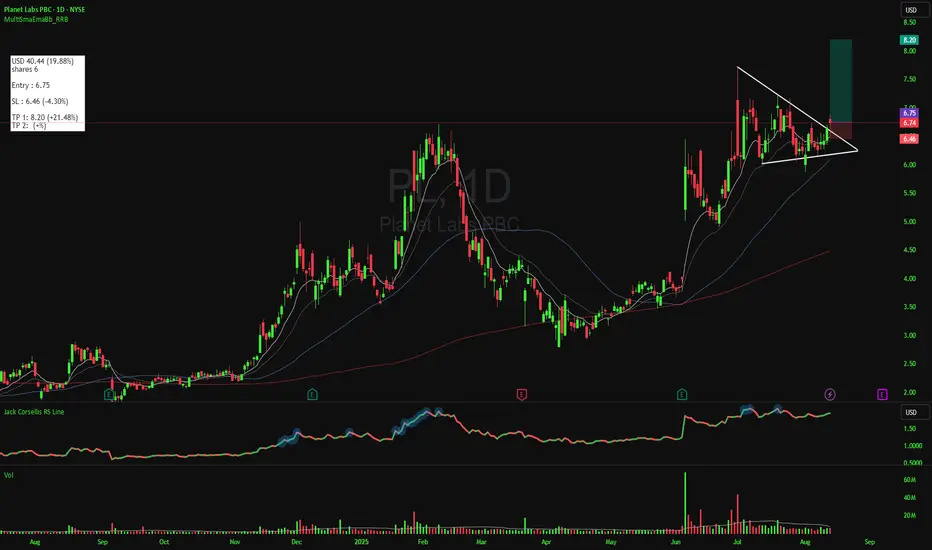
There is also a breakout from Bullish Pennant Pattern, but did not occur on a green candle, which raises concern about whether this is a valid breakout.Still, it's worth keeping an eye on.
Futhermore, the stock is making new highs, as shown by the indicator below (Jack Corsellis RS Line), where a blue light appears when the stock reaches a new high.
Moreover, volume was very low while the price was forming the pattern, which is what we want. The next step is we need to see a breakout with a solid green candle and supported by large volume exceeding the 30-day moving average.
Lastly, earnings per Share (EPS) have shown a recovery from the last quarter, improving from -0.12 in 2025/Q4 to -0.04 in 2026/Q1.
免责声明
这些信息和出版物并非旨在提供,也不构成TradingView提供或认可的任何形式的财务、投资、交易或其他类型的建议或推荐。请阅读使用条款了解更多信息。