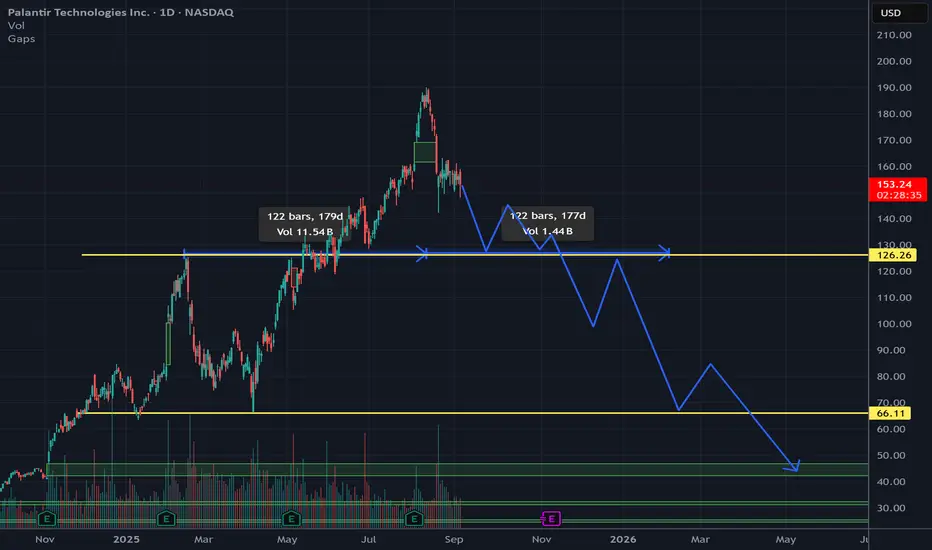
Over 180 days, PLTR climbed aggressively, fueled by high conviction buying. With candlesticks showing strong green bodies and upside momentum, peaking near the $190 52-week high.
This analysis focuses on the fractal comparison in the chart, forecasting an extended bearish phase that could drag the stock significantly lower before any stabilization.
I predict PLTR enters an extended correction phase. This fractal symmetry suggests the downside could match or exceed the prior upside's duration and magnitude, projecting a measured move toward $65 or lower
免责声明
这些信息和出版物并不意味着也不构成TradingView提供或认可的金融、投资、交易或其它类型的建议或背书。请在使用条款阅读更多信息。