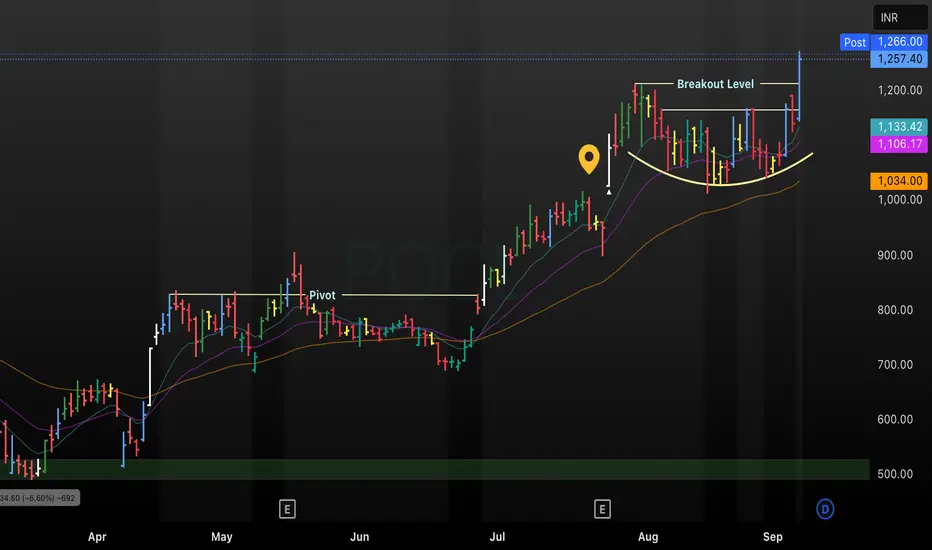
This annotated POCL daily chart tracks price movement from April to September 2025, displaying key technical events including a consolidation pivot, formation of a rounded base, and recent breakout above a major resistance level. Multiple moving averages (including short, medium, and long-term) support bullish momentum, with price closing above the breakout level and confirming a new uptrend. The setup provides trade entry signals and evidence of strengthening market structure for POCL as of September 20
免责声明
这些信息和出版物并非旨在提供,也不构成TradingView提供或认可的任何形式的财务、投资、交易或其他类型的建议或推荐。请阅读使用条款了解更多信息。
免责声明
这些信息和出版物并非旨在提供,也不构成TradingView提供或认可的任何形式的财务、投资、交易或其他类型的建议或推荐。请阅读使用条款了解更多信息。