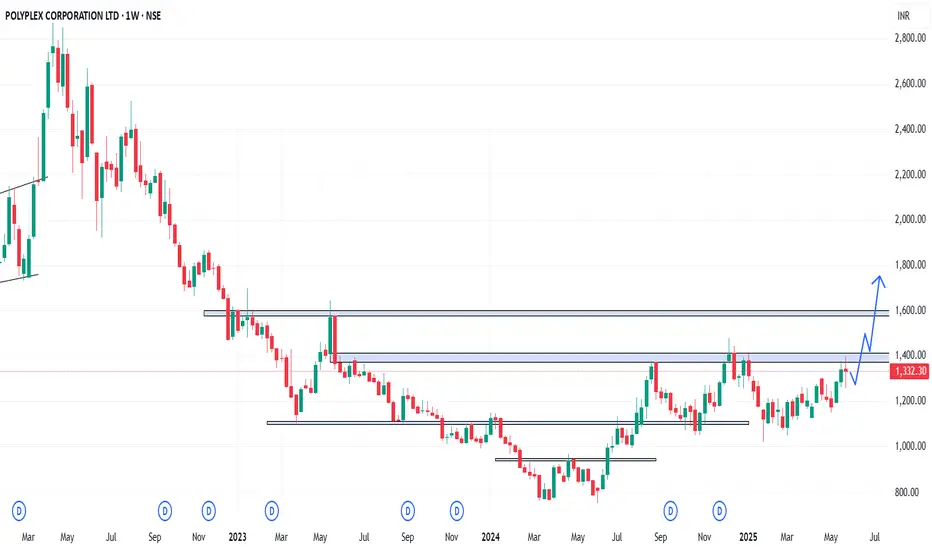
In the Weekly Chart of POLYPLEX ,
we can see that; it has multiple rejections at 1330-1370.
Let it create one or two halt candles to grab strong momentum.
Expected momentum is shown in chart.
we can see that; it has multiple rejections at 1330-1370.
Let it create one or two halt candles to grab strong momentum.
Expected momentum is shown in chart.
免责声明
这些信息和出版物并不意味着也不构成TradingView提供或认可的金融、投资、交易或其它类型的建议或背书。请在使用条款阅读更多信息。
免责声明
这些信息和出版物并不意味着也不构成TradingView提供或认可的金融、投资、交易或其它类型的建议或背书。请在使用条款阅读更多信息。