Clear setup to share on PYPL
Main concepts of the chart:
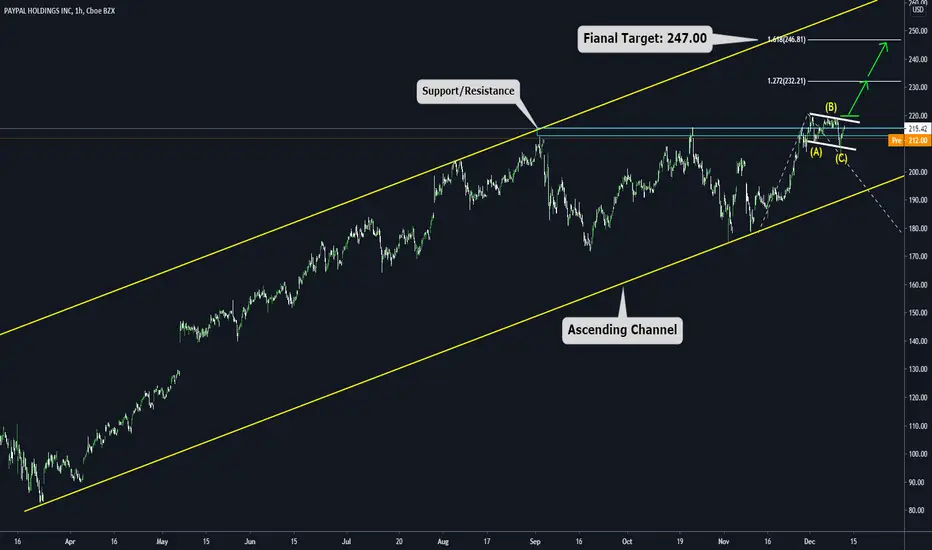
a) The price is inside a major ascending channel (Bullish Structure)
b) We saw a breakout of the last Resistance zone and the price moving on the edge of that level
c) On the edge of the Broken Resistance zone (now working as support), we can see a Flag Pattern (ABC Structure), which is considered a continuation structure (that means that we should expect a bullish movement after the breakout of it)
d) Now let's speak about targets: We have two levels, The first fibo extension (we will use it as a break-even level) and the second fibo extension as a final target
e) IF the trade goes in the expected direction, we think we can have a 15 - 20 days bullish impulse in terms of duration
f) IF the price does not go as expected, we will cancel our bullish view if we see a movement below "C."
Main concepts of the chart:
a) The price is inside a major ascending channel (Bullish Structure)
b) We saw a breakout of the last Resistance zone and the price moving on the edge of that level
c) On the edge of the Broken Resistance zone (now working as support), we can see a Flag Pattern (ABC Structure), which is considered a continuation structure (that means that we should expect a bullish movement after the breakout of it)
d) Now let's speak about targets: We have two levels, The first fibo extension (we will use it as a break-even level) and the second fibo extension as a final target
e) IF the trade goes in the expected direction, we think we can have a 15 - 20 days bullish impulse in terms of duration
f) IF the price does not go as expected, we will cancel our bullish view if we see a movement below "C."
免责声明
这些信息和出版物并非旨在提供,也不构成TradingView提供或认可的任何形式的财务、投资、交易或其他类型的建议或推荐。请阅读使用条款了解更多信息。
免责声明
这些信息和出版物并非旨在提供,也不构成TradingView提供或认可的任何形式的财务、投资、交易或其他类型的建议或推荐。请阅读使用条款了解更多信息。