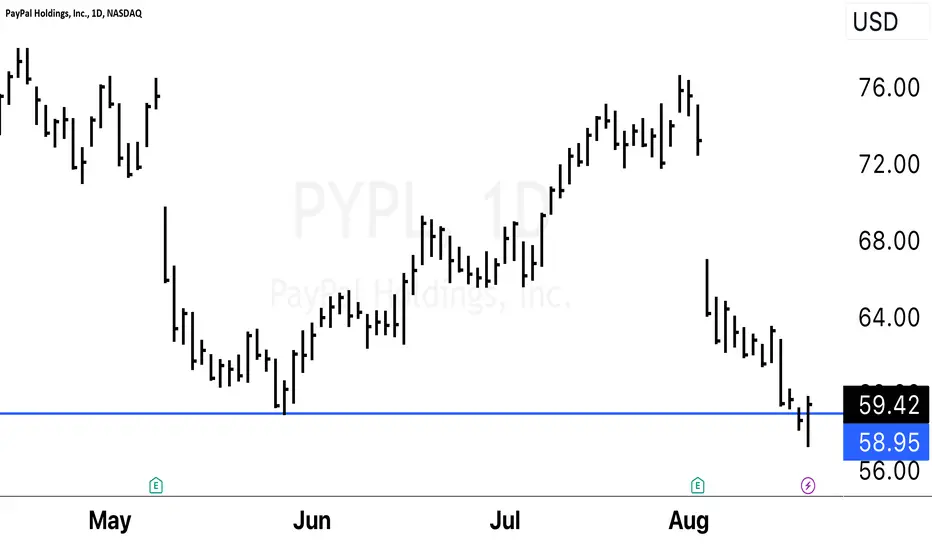
It sounds like you're discussing technical analysis concepts in the context of trading. A "double bottom" is a bullish reversal pattern that occurs after a downtrend and is characterized by two consecutive lows at a similar price level, followed by a breakout above the pattern's neckline. This pattern suggests a potential reversal from the downtrend to an uptrend.
A "false breakdown" occurs when a price breaks below a support level but quickly reverses and closes back above it. This can be interpreted as a bullish sign, indicating that the selling pressure wasn't sustained, and buyers stepped in to push the price back up.
The idea that "the best moves come from failed moves" is a common adage in trading and investing. It suggests that when a market or a security initially breaks out or breaks down and then reverses, it can lead to strong price movements in the opposite direction. This is often attributed to the idea that traders who were positioned on the wrong side of the initial move are forced to close their positions, contributing to the momentum in the opposite direction.
It's important to note that while these concepts are commonly discussed in trading circles, they are not foolproof strategies. Technical analysis is just one approach to understanding price movements in financial markets, and it should be used in conjunction with other forms of analysis and risk management strategies. Markets can be unpredictable, and there is no guarantee that any pattern or signal will always lead to a profitable outcome.
免责声明
这些信息和出版物并非旨在提供,也不构成TradingView提供或认可的任何形式的财务、投资、交易或其他类型的建议或推荐。请阅读使用条款了解更多信息。
免责声明
这些信息和出版物并非旨在提供,也不构成TradingView提供或认可的任何形式的财务、投资、交易或其他类型的建议或推荐。请阅读使用条款了解更多信息。