🔎 Chart Context
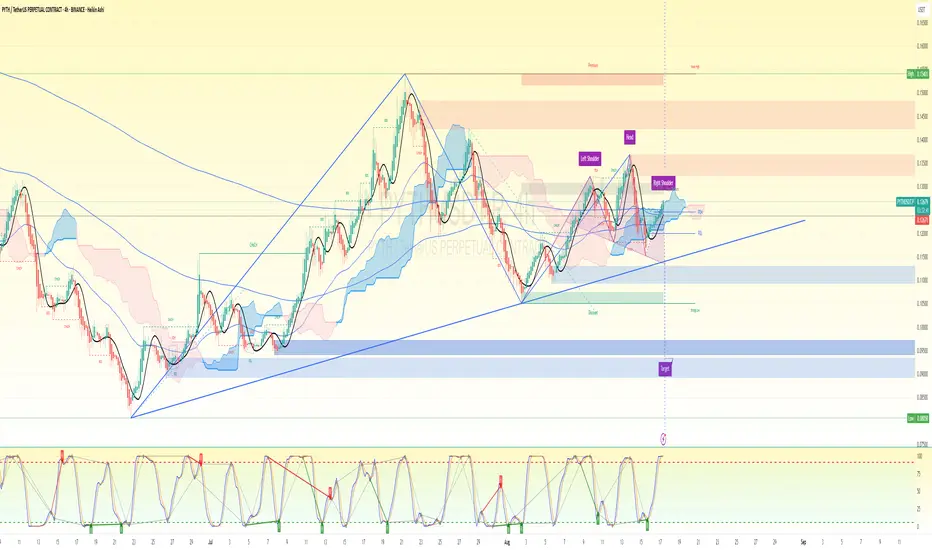
Pattern: A clear Head & Shoulders (H&S) structure has formed. Price is testing the neckline area (~0.126–0.128).
Indicators:
Stochastic RSI is pushing up from oversold → suggesting temporary relief rally.
Price is still inside/near the cloud resistance zone (bearish bias).
Target Zone: Marked at 0.090–0.095, aligning with the measured H&S breakdown.
📍 Precise Sniper Setup
Bias: Bearish (most probable continuation setup).
Entry (Short):
Aggressive: 0.1265 – 0.1280 (current price + neckline retest zone).
Conservative: Wait for a 4h close below 0.1230 (clean neckline break confirmation).
Stop-Loss (SL):
Above Right Shoulder high ~0.1315.
Safer SL: 0.1330 (above liquidity sweep zone).
Take-Profit (TP):
TP1: 0.1150 (near PDL / liquidity pocket).
TP2: 0.1050 (discount zone).
TP3 (Full H&S target): 0.090–0.095 range (your chart’s marked target).
⏳ Estimated Timeframe
If neckline breaks cleanly, TP1–TP2 can be reached in 2–4 days.
Full H&S target (~0.090) could take 5–10 days depending on momentum/volume.
✅ Summary (No bias):
Most probable trade = short from neckline zone (0.126–0.128) with SL above 0.1330 and targets down to 0.095.
If bulls reclaim and hold above 0.1330, the bearish setup is invalidated and shift to neutral → potential upside squeeze into 0.137–0.140.
交易结束:到达目标
Target 1 achieved. 注释
TP 2 Loading免责声明
这些信息和出版物并不意味着也不构成TradingView提供或认可的金融、投资、交易或其它类型的建议或背书。请在使用条款阅读更多信息。