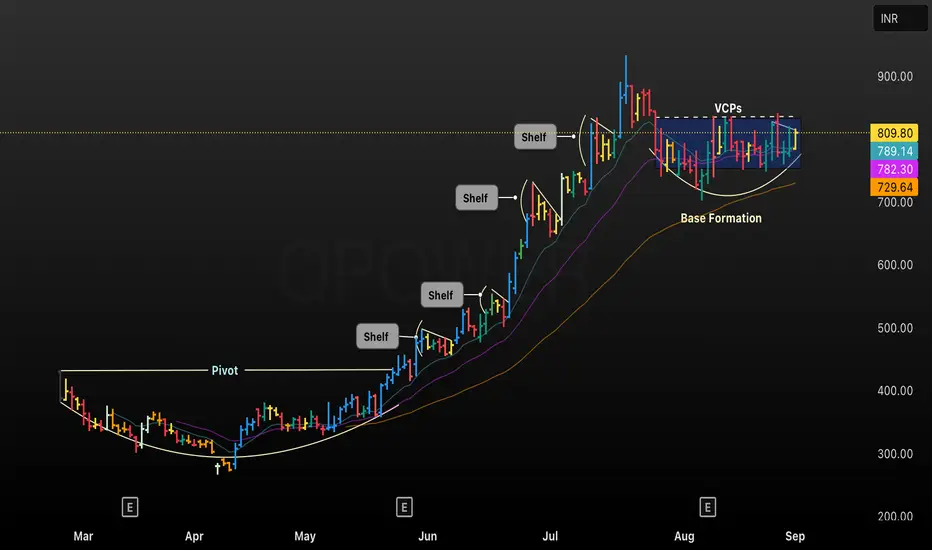
This TradingView chart of QPOWER showcases a classic growth stock progression from a Pivot breakout through multiple consolidation phases known as Shelves, indicated by horizontal pauses in price action above key moving averages. The recent price structure features a well-defined Base Formation followed by multiple VCPs (Volatility Contraction Patterns), signaling tightening price ranges and potential breakout readiness. Key moving averages are highlighted (789.14, 782.30, 729.64) to guide risk management for trend-following entries and exits.
• Technical patterns annotated: Pivot, Shelf, VCP, Base Formation
• Chart timeframe: Daily (D)
• Purpose: Used for trade decision-making and educational discussion on breakout setups and volatility contraction patterns
• Technical patterns annotated: Pivot, Shelf, VCP, Base Formation
• Chart timeframe: Daily (D)
• Purpose: Used for trade decision-making and educational discussion on breakout setups and volatility contraction patterns
免责声明
这些信息和出版物并非旨在提供,也不构成TradingView提供或认可的任何形式的财务、投资、交易或其他类型的建议或推荐。请阅读使用条款了解更多信息。
免责声明
这些信息和出版物并非旨在提供,也不构成TradingView提供或认可的任何形式的财务、投资、交易或其他类型的建议或推荐。请阅读使用条款了解更多信息。