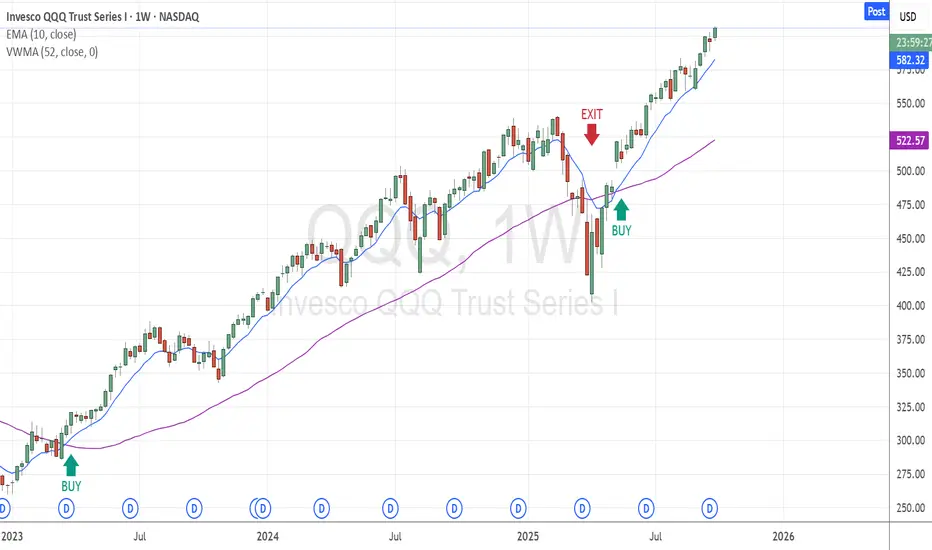
This strategy is designed for long-term investors using a simple, two-indicator setup on the weekly chart:
• VWMA (Volume-Weighted Moving Average) – 52-period
• EMA (Exponential Moving Average) – 10-period
✅ Entry Signal (Buy)
• Enter a position when the 10-period EMA crosses above the 52-period VWMA.
This crossover suggests a potential upward trend supported by volume.
❌ Exit Signal (close Long Position)
• Exit the position when the 10-period EMA crosses below the 52-period VWMA.
This indicates a possible trend reversal or weakening momentum.
💡 Additional Note
• When the 10 EMA is below the 52 VWMA, it's best to stay in cash and wait patiently for the next bullish crossover. This helps avoid false entries and keeps you aligned with the broader trend.
免责声明
这些信息和出版物并不意味着也不构成TradingView提供或认可的金融、投资、交易或其它类型的建议或背书。请在使用条款阅读更多信息。