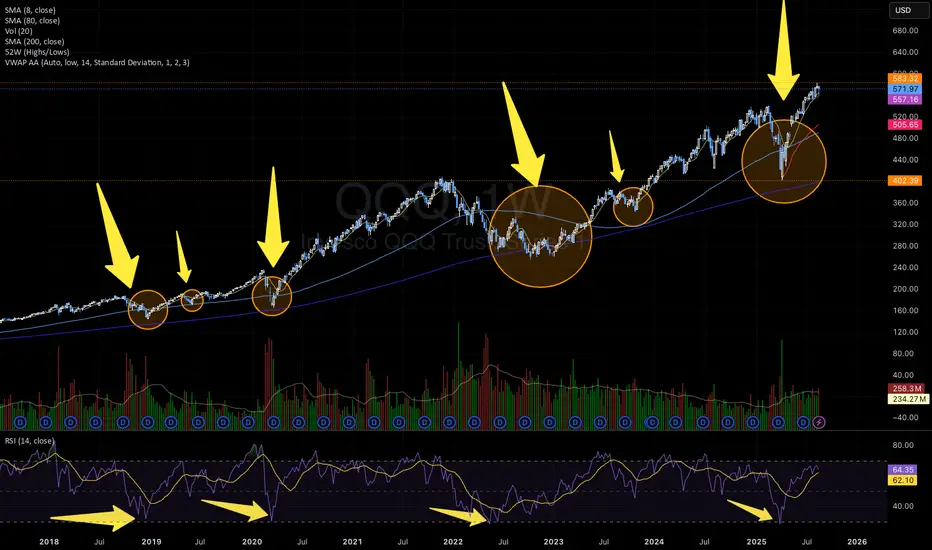
On the QQQ weekly chart, a recurring bullish pattern has emerged multiple times over the last years:
1) V-shape recoveries followed by Cup & Handle formations and then a shakeout, all of which preceded powerful upside moves (highlighted with arrows and circles).
2) Each time the weekly RSI touched the 30 zone, it triggered a strong bullish rally. This happened three times in the past (2018, 2020, 2022) and just occurred again in March/April 2025.
3) Both times the Cup & Handle pattern formed, the RSI found support around the 45 level.
This suggests that QQQ may be setting up for another bullish leg if history repeats itself.
📊 Key Takeaways:
⚠️ Not financial advice — purely a technical pattern study.
1) V-shape recoveries followed by Cup & Handle formations and then a shakeout, all of which preceded powerful upside moves (highlighted with arrows and circles).
2) Each time the weekly RSI touched the 30 zone, it triggered a strong bullish rally. This happened three times in the past (2018, 2020, 2022) and just occurred again in March/April 2025.
3) Both times the Cup & Handle pattern formed, the RSI found support around the 45 level.
This suggests that QQQ may be setting up for another bullish leg if history repeats itself.
📊 Key Takeaways:
- Weekly RSI bouncing from oversold (30 zone)
- Recurrent V-Shape + Cup & Handle + Shakeout bullish pattern
- Strong rallies historically followed this setup
⚠️ Not financial advice — purely a technical pattern study.
免责声明
这些信息和出版物并非旨在提供,也不构成TradingView提供或认可的任何形式的财务、投资、交易或其他类型的建议或推荐。请阅读使用条款了解更多信息。
免责声明
这些信息和出版物并非旨在提供,也不构成TradingView提供或认可的任何形式的财务、投资、交易或其他类型的建议或推荐。请阅读使用条款了解更多信息。