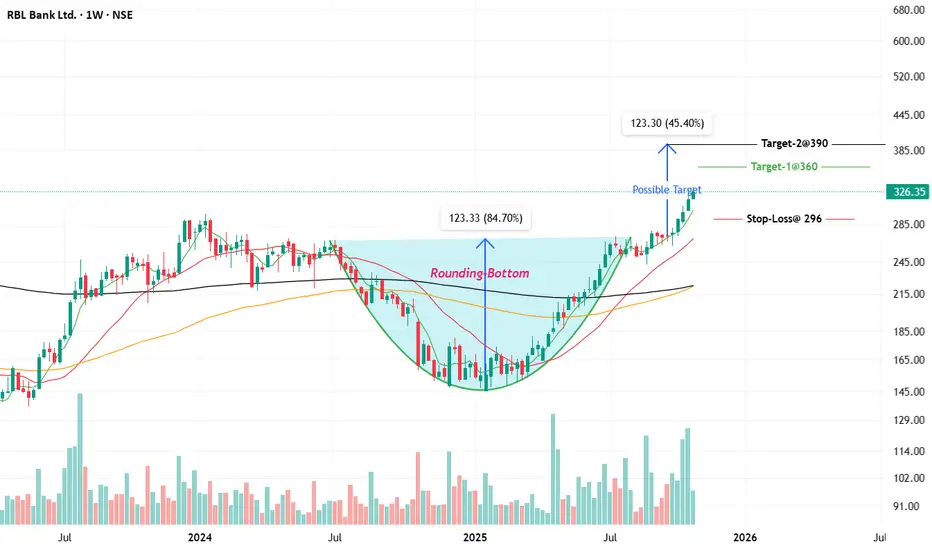
RBL Bank has shown strong bullish momentum in its weekly chart, supported by rising price, strong moving averages, and a robust uptrend. The stock is currently trading near its 52-week high at around ₹326, indicating significant strength in the ongoing trend.
Technical Indicator Analysis
• Price and Trend: The stock has risen over 42% in the past year and over 7% in the last month, supported by strong volume and positive sentiment.
• Moving Averages: The 50-week and 200-week moving averages are sloping upwards, and the price is trading well above both, which is a bullish sign.
• Relative Strength: RSI (implied by the breakout and new highs) likely remains in bullish territory, confirming momentum.
• Support and Resistance: The stock has immediate support near ₹300 and strong resistance is seen at the recent high of ₹331.50.
Chart Pattern and Target
• Pattern Observed: A continuation breakout, possibly following a flag or rounding bottom pattern, is implied. The price action has broken past key resistances, and the trend remains strong.
• Entry Point: New entries can be considered on minor pullbacks toward ₹310-315, or on a weekly close above ₹331.50 for momentum traders.
• Target: Immediate target is the all-time range toward ₹350. If momentum continues, longer-term targets could be in the ₹380–400 zone, using previous swing projections and extension from current levels.
• Stop Loss: Suggested stop-loss for positional trades is below ₹296 on a closing basis to protect gains and manage downside risk.
Overall, the weekly technical for RBL Bank support a bullish stance with buy-on-dip and breakout strategies, as long as the price remains above the key moving averages and stop-loss.
📌 Thanks a ton for checking out my idea! Hope it sparked some value for you.
🙏 Follow for more insights
👍 Boost if you found it helpful
✍️ Drop a comment with your thoughts below!
相关出版物
免责声明
这些信息和出版物并非旨在提供,也不构成TradingView提供或认可的任何形式的财务、投资、交易或其他类型的建议或推荐。请阅读使用条款了解更多信息。