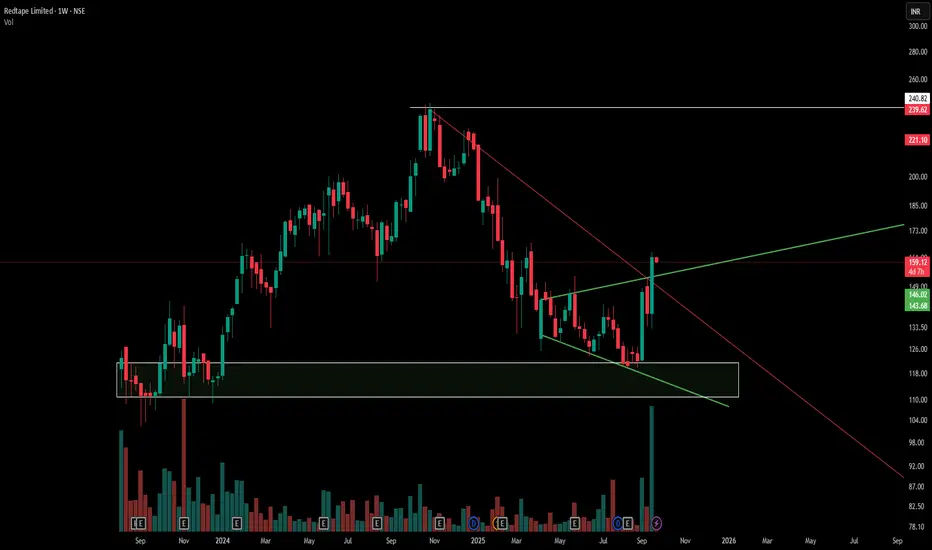
This chart offers a deep dive into three vital technical pillars:
1) White Box -The demand box marks a price area where buying strength repeatedly emerges, acting as a support anchor.
2) White line - The supply line overhead identifies zones where selling pressure historically dominates, framing resistance.
3) The Red line -A red counter trendline (CT) tracks recent corrective moves against the broader swing, helping isolate short-term rotation.
4) The Green line -Overlaying these, the green broadening pattern signals consolidation through widening highs and lows—a structure often missed at first glance.
By stacking supply, demand, counter trendlines, and broadening consolidation, traders can recognize layered market behavior. Patterns rarely exist in isolation; understanding their interplay builds disciplined chart reading skills and deepens price action insight.
Disclaimer: This content is for educational purposes and not financial advice. Always do your own research before making trading decisions.
🎯 Master My Self-Made Trading Strategy
📈 Telegram (Learn Today): t.me/hashtaghammer
✅ WhatsApp (Learn Today): wa.me/919455664601
📈 Telegram (Learn Today): t.me/hashtaghammer
✅ WhatsApp (Learn Today): wa.me/919455664601
相关出版物
免责声明
这些信息和出版物并非旨在提供,也不构成TradingView提供或认可的任何形式的财务、投资、交易或其他类型的建议或推荐。请阅读使用条款了解更多信息。