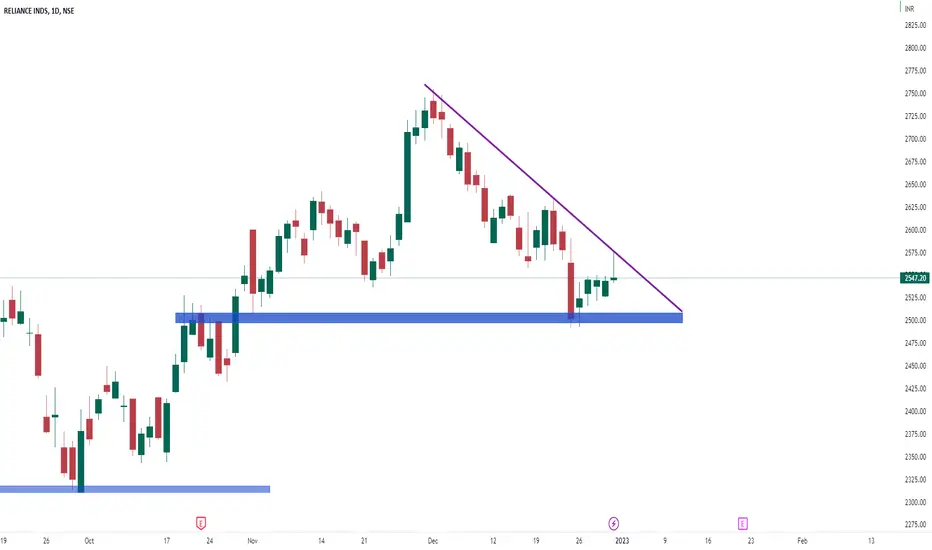
Day chart of reliance ind
it is making triangle pattern on daily chart in which important support zone is 2490 zone and Resistance is trendline
& today it is making inverse hammer candle which indicates bearish view for monday. On monday if this stocks breaks friday low then I will start shorting.
it is making triangle pattern on daily chart in which important support zone is 2490 zone and Resistance is trendline
& today it is making inverse hammer candle which indicates bearish view for monday. On monday if this stocks breaks friday low then I will start shorting.
免责声明
这些信息和出版物并不意味着也不构成TradingView提供或认可的金融、投资、交易或其它类型的建议或背书。请在使用条款阅读更多信息。