Here’s a detailed technical analysis of **Reliance Industries Ltd (RELIANCE)** based on the images you provided:
---
### 📊 **1️⃣ Pattern Overview:**
* **Falling Wedge Pattern:**
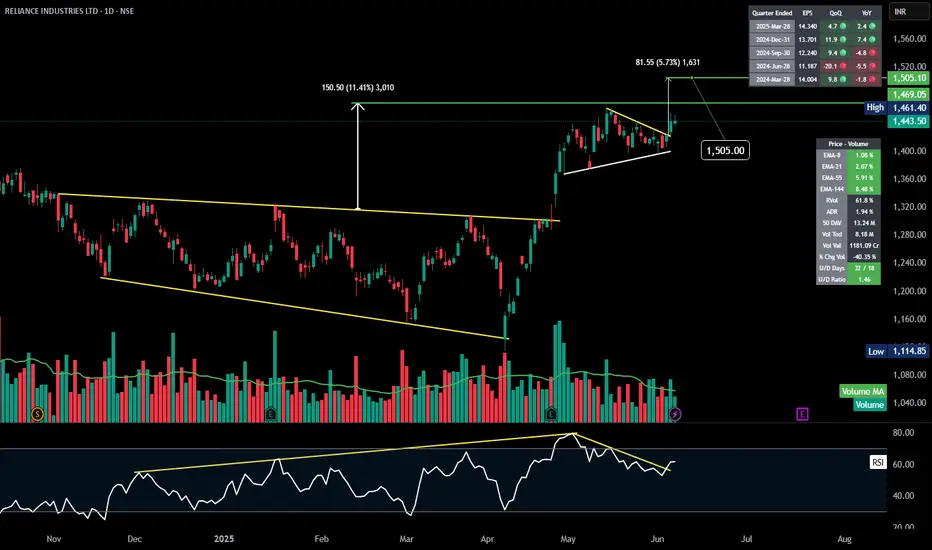
* A large falling wedge spanning several months from 2024 to early 2025, clearly visible in the first set of images.
* The stock broke out of the wedge in April-May 2025, leading to a significant up-move.
* **Continuation Triangle Pattern:**
* Post breakout, the stock formed a symmetrical triangle (or continuation pennant) in late May to early June 2025.
* The stock has just broken out of this consolidation, suggesting a continuation of the uptrend.
---
### 📈 **2️⃣ Key Levels:**
* **Breakout Levels:**
* Falling Wedge breakout: Around **1,300**
* Continuation Triangle breakout: Around **1,443.50 - 1,461.40**
* **Current Price:** **1,443.50**
* **Measured Move Targets:**
* Wedge depth measured move: \~**150.50 points** (11.41%)
* Continuation triangle target: \~**81.55 points** (5.73%)
* **Price Targets:** **1,505.00** and possibly **1,531 - 1,540** based on the continuation move.
---
### 💡 **3️⃣ Indicators & Confirmation:**
* **Volume:**
* Noticeable volume spikes during breakouts, confirming strong buying interest.
* Post-breakout consolidation volumes have been healthy (lower, indicating accumulation).
* **RSI:**
* Divergence in RSI before the wedge breakout (lower lows in price, but not in RSI – bullish divergence).
* Currently, RSI is bouncing back from around 60, supporting continued bullish momentum.
* **EMA Analysis:**
* EMA-8, EMA-21, EMA-55, EMA-144 all sloping up, indicating strong trend alignment.
* EMA-8 and EMA-21 holding as dynamic support, especially on the 1,443 breakout.
---
### ⚙️ **4️⃣ Key Support and Resistance:**
* **Supports:**
* 1,443-1,461 zone: Breakout levels and EMA cluster support.
* 1,300 zone: Former wedge breakout level and major pivot support.
* **Immediate Resistance:**
* 1,505.00 (immediate price target)
* Followed by 1,531-1,540 zone.
---
### 🚦 **5️⃣ Risk Management / Trade Strategy:**
* **Stops:**
* Conservative stop-loss: Below 1,443 (immediate breakout zone).
* Wider stop-loss: Below 1,400 (where EMA-21 is likely to support).
* **Entry:**
* Re-entry on pullbacks to breakout levels (1,443-1,461) with tight risk control.
* **Upside Potential:**
* Short-term: 1,505
* Medium-term: 1,540 zone
---
### 🔍 **Summary:**
✅ **Bullish Wedge breakout** has been confirmed and has driven the stock significantly higher.
✅ **Continuation triangle breakout** at 1,443-1,461 zone suggests further upside to 1,505 and 1,540.
✅ RSI, volume, and EMAs align with a continued bullish bias.
---
💬 **Would you like me to draft a YouTube video script, a trading plan document, or a social media post for this analysis? Let me know! 🚀**
---
### 📊 **1️⃣ Pattern Overview:**
* **Falling Wedge Pattern:**
* A large falling wedge spanning several months from 2024 to early 2025, clearly visible in the first set of images.
* The stock broke out of the wedge in April-May 2025, leading to a significant up-move.
* **Continuation Triangle Pattern:**
* Post breakout, the stock formed a symmetrical triangle (or continuation pennant) in late May to early June 2025.
* The stock has just broken out of this consolidation, suggesting a continuation of the uptrend.
---
### 📈 **2️⃣ Key Levels:**
* **Breakout Levels:**
* Falling Wedge breakout: Around **1,300**
* Continuation Triangle breakout: Around **1,443.50 - 1,461.40**
* **Current Price:** **1,443.50**
* **Measured Move Targets:**
* Wedge depth measured move: \~**150.50 points** (11.41%)
* Continuation triangle target: \~**81.55 points** (5.73%)
* **Price Targets:** **1,505.00** and possibly **1,531 - 1,540** based on the continuation move.
---
### 💡 **3️⃣ Indicators & Confirmation:**
* **Volume:**
* Noticeable volume spikes during breakouts, confirming strong buying interest.
* Post-breakout consolidation volumes have been healthy (lower, indicating accumulation).
* **RSI:**
* Divergence in RSI before the wedge breakout (lower lows in price, but not in RSI – bullish divergence).
* Currently, RSI is bouncing back from around 60, supporting continued bullish momentum.
* **EMA Analysis:**
* EMA-8, EMA-21, EMA-55, EMA-144 all sloping up, indicating strong trend alignment.
* EMA-8 and EMA-21 holding as dynamic support, especially on the 1,443 breakout.
---
### ⚙️ **4️⃣ Key Support and Resistance:**
* **Supports:**
* 1,443-1,461 zone: Breakout levels and EMA cluster support.
* 1,300 zone: Former wedge breakout level and major pivot support.
* **Immediate Resistance:**
* 1,505.00 (immediate price target)
* Followed by 1,531-1,540 zone.
---
### 🚦 **5️⃣ Risk Management / Trade Strategy:**
* **Stops:**
* Conservative stop-loss: Below 1,443 (immediate breakout zone).
* Wider stop-loss: Below 1,400 (where EMA-21 is likely to support).
* **Entry:**
* Re-entry on pullbacks to breakout levels (1,443-1,461) with tight risk control.
* **Upside Potential:**
* Short-term: 1,505
* Medium-term: 1,540 zone
---
### 🔍 **Summary:**
✅ **Bullish Wedge breakout** has been confirmed and has driven the stock significantly higher.
✅ **Continuation triangle breakout** at 1,443-1,461 zone suggests further upside to 1,505 and 1,540.
✅ RSI, volume, and EMAs align with a continued bullish bias.
---
💬 **Would you like me to draft a YouTube video script, a trading plan document, or a social media post for this analysis? Let me know! 🚀**
免责声明
这些信息和出版物并不意味着也不构成TradingView提供或认可的金融、投资、交易或其它类型的建议或背书。请在使用条款阅读更多信息。
免责声明
这些信息和出版物并不意味着也不构成TradingView提供或认可的金融、投资、交易或其它类型的建议或背书。请在使用条款阅读更多信息。