📊 Intraday Price Movement
Opening Price: ₹135.00
Day's Range: ₹131.60 – ₹139.21
Previous Close: ₹135.46
Volume Traded: Approximately 711,000 shares
Market Cap: ₹1,453.32 crore
🔧 Technical Indicators
Relative Strength Index (RSI): 72.25, indicating potential overbought conditions
Moving Average Convergence Divergence (MACD): 0.82, suggesting a bullish trend.
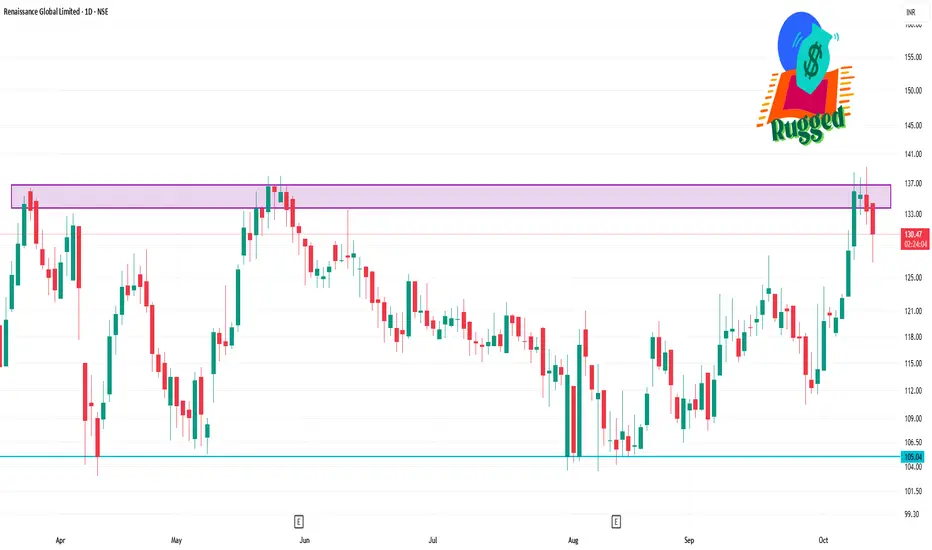
Support Levels: ₹130.00 and ₹131.60
Resistance Levels: ₹135.46 and ₹139.21
📈 52-Week Range
High: ₹207.40
Low: ₹103.01
Opening Price: ₹135.00
Day's Range: ₹131.60 – ₹139.21
Previous Close: ₹135.46
Volume Traded: Approximately 711,000 shares
Market Cap: ₹1,453.32 crore
🔧 Technical Indicators
Relative Strength Index (RSI): 72.25, indicating potential overbought conditions
Moving Average Convergence Divergence (MACD): 0.82, suggesting a bullish trend.
Support Levels: ₹130.00 and ₹131.60
Resistance Levels: ₹135.46 and ₹139.21
📈 52-Week Range
High: ₹207.40
Low: ₹103.01
相关出版物
免责声明
这些信息和出版物并非旨在提供,也不构成TradingView提供或认可的任何形式的财务、投资、交易或其他类型的建议或推荐。请阅读使用条款了解更多信息。