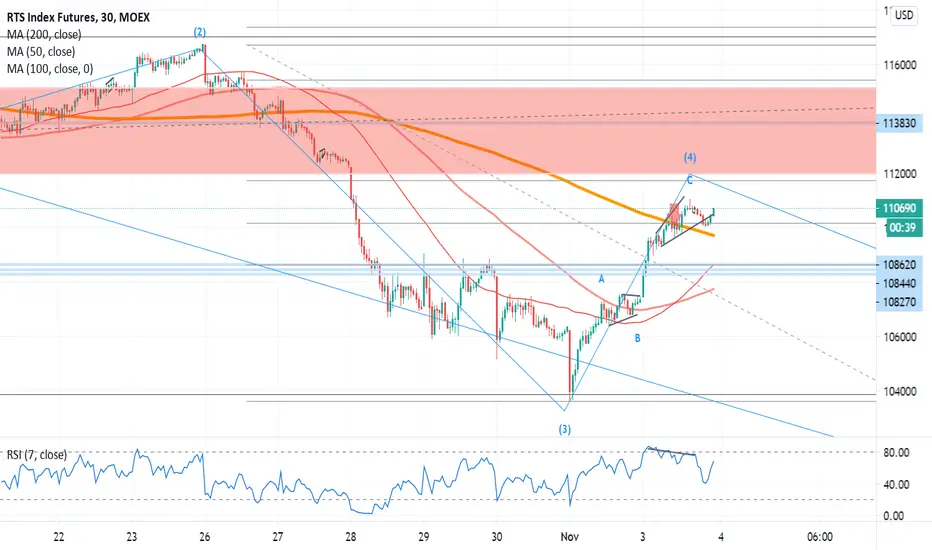
It looks like RTS has just completed wave 4 (before US ballot results announcement) with a simple ABC, with wave 5 of C coming out as an expanding diagonal confirmed by RSI divergence. This is a perfect setup. The timeframe is a bit too low but hey looks good. The tip of the wave 4 is marked with bearish candles on every timeframe starting from 1 min to Daily.
➡️t.me/charta_energeia — regular Elliott Wave and trend analysis on Oil, Gas, and Crypto.
免责声明
这些信息和出版物并非旨在提供,也不构成TradingView提供或认可的任何形式的财务、投资、交易或其他类型的建议或推荐。请阅读使用条款了解更多信息。
➡️t.me/charta_energeia — regular Elliott Wave and trend analysis on Oil, Gas, and Crypto.
免责声明
这些信息和出版物并非旨在提供,也不构成TradingView提供或认可的任何形式的财务、投资、交易或其他类型的建议或推荐。请阅读使用条款了解更多信息。