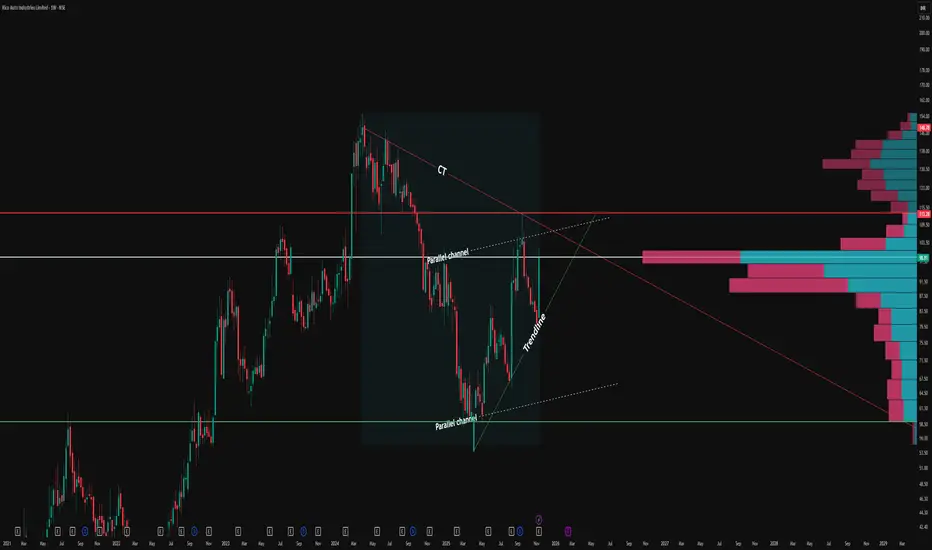
The CT (Counter Trendline) as the prime technical feature. The red CT line distinctly marks recurring lower high rejections, shaping significant supply pockets and creating low-liquidity price zones at every inflection point.
Each touch validates the CT’s relevance, highlighting how price is repeatedly capped at these lower highs before reversing downward.
Overlaying this, a hidden parallel channel (dotted white lines) frames the swing movement. The channel not only encapsulates price but also serves as a running test of trend strength: each upper boundary touch confirms resistance, while bottoms act as support.
Notably, more hits at the upper parallel line than the base typically signal rising underlying bullish energy, especially when accompanied by the green trendline’s upward momentum.
No breakout, no prediction—just objective structure. The parallel channel and trendlines, when mapped carefully, elevate clarity on price balancers, guidance zones, and the ongoing duel between support and rejection.
Observe how these formations reveal crowd psychology and liquidity placement without forcing a directional view.
🎯 Master My Self-Made Trading Strategy
📈 Telegram (Learn Today): t.me/hashtaghammer
✅ WhatsApp (Learn Today): wa.me/919455664601
📈 Telegram (Learn Today): t.me/hashtaghammer
✅ WhatsApp (Learn Today): wa.me/919455664601
相关出版物
免责声明
这些信息和出版物并非旨在提供,也不构成TradingView提供或认可的任何形式的财务、投资、交易或其他类型的建议或推荐。请阅读使用条款了解更多信息。