📊 Riot Platforms (RIOT) – Technical Analysis
1. Current Price Action
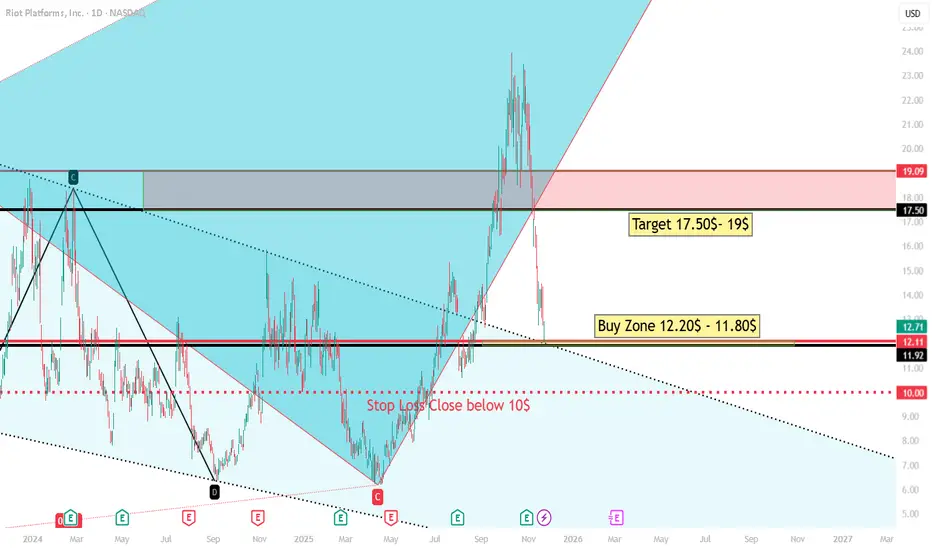
The stock is trading around $12.7, showing a sharp pullback after a strong rally. The recent decline brought price back into a previously established demand/support region.
2. Key Levels
🔵 Buy Zone: $12.20 – $11.80
This zone is clearly marked on your chart and aligns with:
A previous support–resistance flip
The lower boundary of the recent breakout area
A potential Fibonacci retracement region (based on the structure)
Price is currently sitting just above this area, meaning the stock is approaching an attractive risk-to-reward entry level.
🔴 Stop Loss: Close Below $10
The $10 level is critical because:
It’s a major psychological support
It aligns with the bottom of a broader descending trendline zone
A close below it would break the bullish structure and invalidate the long setup
This makes it a logical and conservative stop-loss placement.
3. Target Zones
🎯 Target 1: $17.50
This level corresponds to:
The previous consolidation / supply zone
A Fibonacci extension / measured move region
A strong horizontal resistance visible on the chart
🎯 Target 2: $19.00
This is the upper boundary of the supply zone and a likely strong resistance point if momentum continues.
These targets provide a 3:1 to 4:1 risk-to-reward ratio, making the trade setup attractive if the buy zone holds.
4. Trend Structure
Your chart highlights:
A completed harmonic/gartley-like formation (C-D leg)
A breakout from a long-term descending trendline
A bullish channel formation after the breakout
The current pullback appears to be a healthy retest of:
The breakout zone
Major support
Demand region
If price stabilizes around $12.20–$11.80, the uptrend may resume.
5. Volume & Momentum
Although not explicitly shown in the screenshot, the price behavior indicates:
A sharp decline but without major capitulation volume
A possible formation of a higher low (if Buy Zone holds)
This suggests sellers may be losing strength as price approaches support.
📈 Summary – Professional Outlook
Bias: Bullish as long as price stays above $10
Entry Area: $12.20 – $11.80 (high-probability demand zone)
Targets:
First: $17.50
Second: $19.00
Stop Loss: Close below $10
Setup Type: Pullback to support / trend continuation
1. Current Price Action
The stock is trading around $12.7, showing a sharp pullback after a strong rally. The recent decline brought price back into a previously established demand/support region.
2. Key Levels
🔵 Buy Zone: $12.20 – $11.80
This zone is clearly marked on your chart and aligns with:
A previous support–resistance flip
The lower boundary of the recent breakout area
A potential Fibonacci retracement region (based on the structure)
Price is currently sitting just above this area, meaning the stock is approaching an attractive risk-to-reward entry level.
🔴 Stop Loss: Close Below $10
The $10 level is critical because:
It’s a major psychological support
It aligns with the bottom of a broader descending trendline zone
A close below it would break the bullish structure and invalidate the long setup
This makes it a logical and conservative stop-loss placement.
3. Target Zones
🎯 Target 1: $17.50
This level corresponds to:
The previous consolidation / supply zone
A Fibonacci extension / measured move region
A strong horizontal resistance visible on the chart
🎯 Target 2: $19.00
This is the upper boundary of the supply zone and a likely strong resistance point if momentum continues.
These targets provide a 3:1 to 4:1 risk-to-reward ratio, making the trade setup attractive if the buy zone holds.
4. Trend Structure
Your chart highlights:
A completed harmonic/gartley-like formation (C-D leg)
A breakout from a long-term descending trendline
A bullish channel formation after the breakout
The current pullback appears to be a healthy retest of:
The breakout zone
Major support
Demand region
If price stabilizes around $12.20–$11.80, the uptrend may resume.
5. Volume & Momentum
Although not explicitly shown in the screenshot, the price behavior indicates:
A sharp decline but without major capitulation volume
A possible formation of a higher low (if Buy Zone holds)
This suggests sellers may be losing strength as price approaches support.
📈 Summary – Professional Outlook
Bias: Bullish as long as price stays above $10
Entry Area: $12.20 – $11.80 (high-probability demand zone)
Targets:
First: $17.50
Second: $19.00
Stop Loss: Close below $10
Setup Type: Pullback to support / trend continuation
免责声明
这些信息和出版物并非旨在提供,也不构成TradingView提供或认可的任何形式的财务、投资、交易或其他类型的建议或推荐。请阅读使用条款了解更多信息。
免责声明
这些信息和出版物并非旨在提供,也不构成TradingView提供或认可的任何形式的财务、投资、交易或其他类型的建议或推荐。请阅读使用条款了解更多信息。