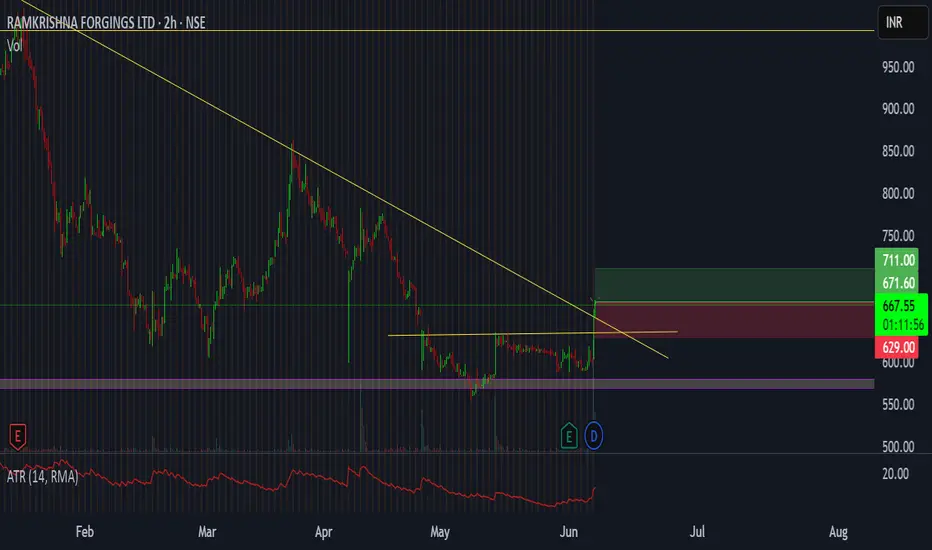
The area around 575 is a strong support on daily and weekly chart (long term support),
In the last four months, the stock has bounced off from around this level with a rise in volume,
every time higher than the previous,
A triangular pattern is also visible , having formed during this period, and now a small rectangular pattern is also visible,
A breakout through all of these has occurred today
Thus, for a short term trade,
tgt 711, sl 629
交易结束:到达止损
免责声明
这些信息和出版物并不意味着也不构成TradingView提供或认可的金融、投资、交易或其它类型的建议或背书。请在使用条款阅读更多信息。