$RSP This chart becomes significantly crucial if the trend line

37
RSP This chart becomes significantly crucial if the trend line is breached. "trend line break" refers to a situation where the price of an asset moves beyond or crosses over a trend line that has been drawn on a price chart. Trend lines are used to represent the direction and strength of a trend in a market. A trend line break can signal a potential change in the trend direction or a shift in market sentiment.
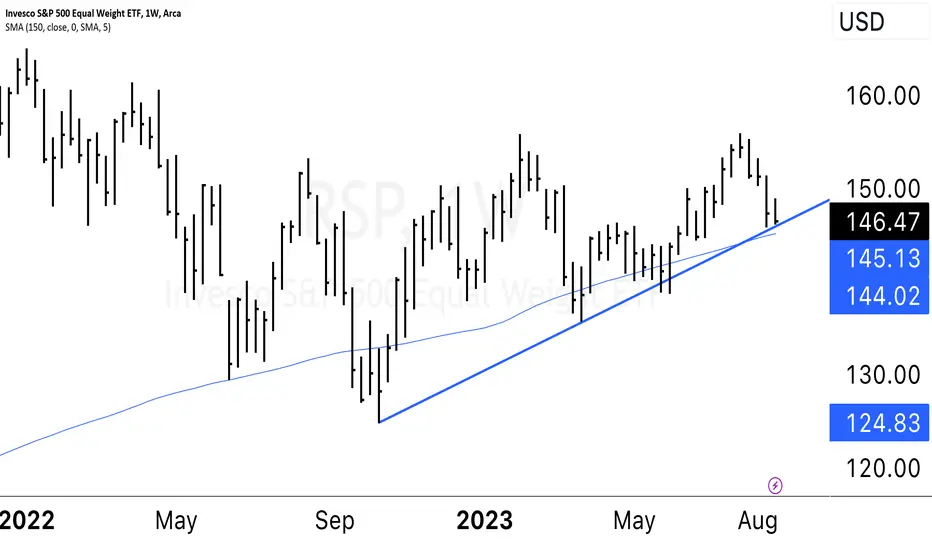
Uptrend Line Break: An uptrend line break occurs when the price moves below an ascending trend line. This can indicate a potential shift from an uptrend to a downtrend or a period of consolidation.

免责声明

这些信息和出版物并不意味着也不构成TradingView提供或认可的金融、投资、交易或其它类型的建议或背书。请在使用条款阅读更多信息。