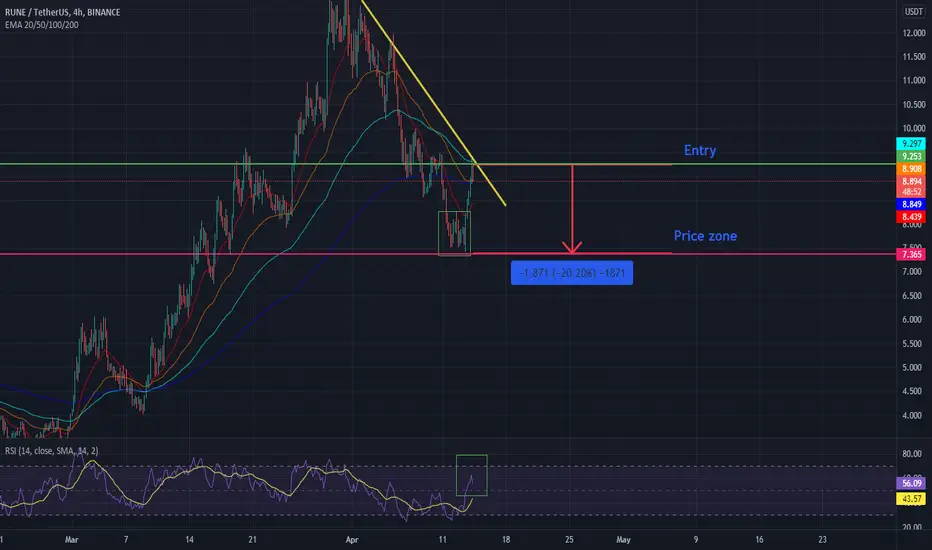
The RUNE/USDT has showed a double top pattern on the 4H chart and is likely to play out on the longer time frames.
This follows a likely price drop from 9.29 USDT to 7.38 USDT. A drop in 20%.
This also follows a rejection from the EMA lines and the RSI shows signs of being overbought.
Here has the analysis showed sign of playing out on the daily time frame.
No financial advice.
This follows a likely price drop from 9.29 USDT to 7.38 USDT. A drop in 20%.
This also follows a rejection from the EMA lines and the RSI shows signs of being overbought.
Here has the analysis showed sign of playing out on the daily time frame.
No financial advice.
💥 Free signals and ideas ➡ t.me/vfinvestment
免责声明
这些信息和出版物并不意味着也不构成TradingView提供或认可的金融、投资、交易或其它类型的建议或背书。请在使用条款阅读更多信息。
💥 Free signals and ideas ➡ t.me/vfinvestment
免责声明
这些信息和出版物并不意味着也不构成TradingView提供或认可的金融、投资、交易或其它类型的建议或背书。请在使用条款阅读更多信息。