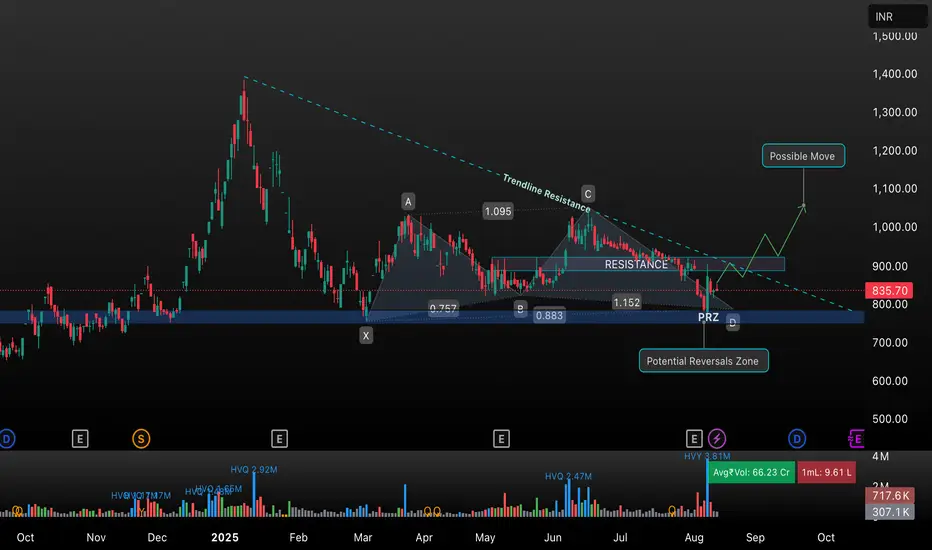
In this analysis, we review the daily chart of Shakti Pumps (SHAKTIPUMP) as presented on TradingView. The stock is currently trading at ₹835.70 and is approaching a crucial trendline resistance. The chart highlights:
• Bearish Trendline Resistance: Connecting recent highs.
• Key Support Zone: Identified as the “Potential Reversal Zone (PRZ)” between ₹750-₹850.
• Bullish Reversal Pattern: The stock has retested the PRZ multiple times, indicating strong support.
• Breakout Setup: A breakout above the resistance could trigger a move towards ₹1,100-₹1,200 as marked in the “Possible Move” target zone.
• Volume Analysis: Observing significant trading volumes at key zones.
Trading Idea:
If the stock breaks above the highlighted resistance and trendline, there is a potential for a strong bullish move. Watch for confirmation and manage risk accordingly.
交易开始
Volume Surged 免责声明
这些信息和出版物并不意味着也不构成TradingView提供或认可的金融、投资、交易或其它类型的建议或背书。请在使用条款阅读更多信息。
免责声明
这些信息和出版物并不意味着也不构成TradingView提供或认可的金融、投资、交易或其它类型的建议或背书。请在使用条款阅读更多信息。