Shiba Inu (SHIB) technical analysis:
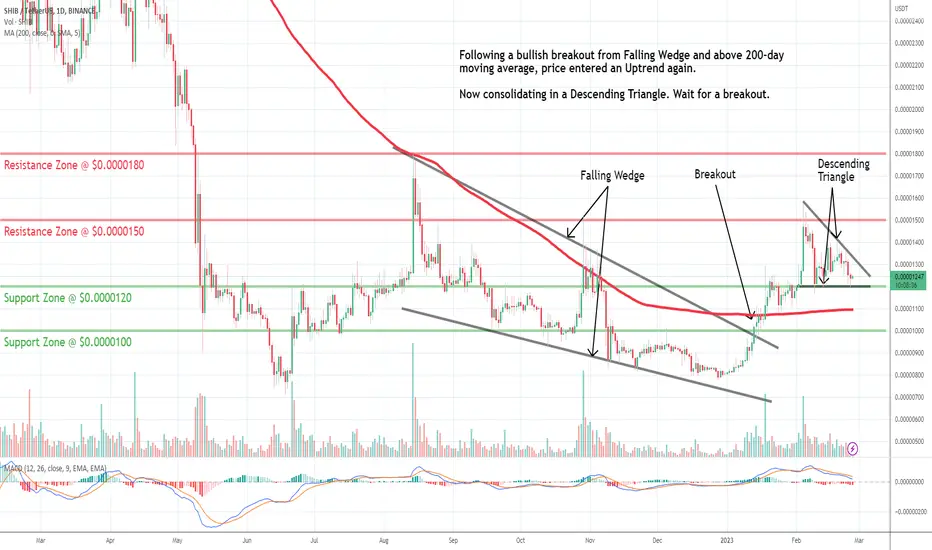
Trade setup: Following a bullish breakout from Falling Wedge and above 200-day moving average, price entered an Uptrend again. Now it’s consolidating in a from Descending triangle Pattern. Wait for a breakout.
Trend: Neutral on Short-Term basis and Uptrend on Medium- and Long-Term basis.
Momentum is Mixed as MACD Line is below MACD Signal Line (Bearish) but RSI ~ 50 (Neutral).
Support and Resistance: Nearest Support Zone is $0.000012 (previous resistance), then $0.000010. The nearest Resistance Zone is $0.000015, then $0.0000180.
免责声明
这些信息和出版物并不意味着也不构成TradingView提供或认可的金融、投资、交易或其它类型的建议或背书。请在使用条款阅读更多信息。