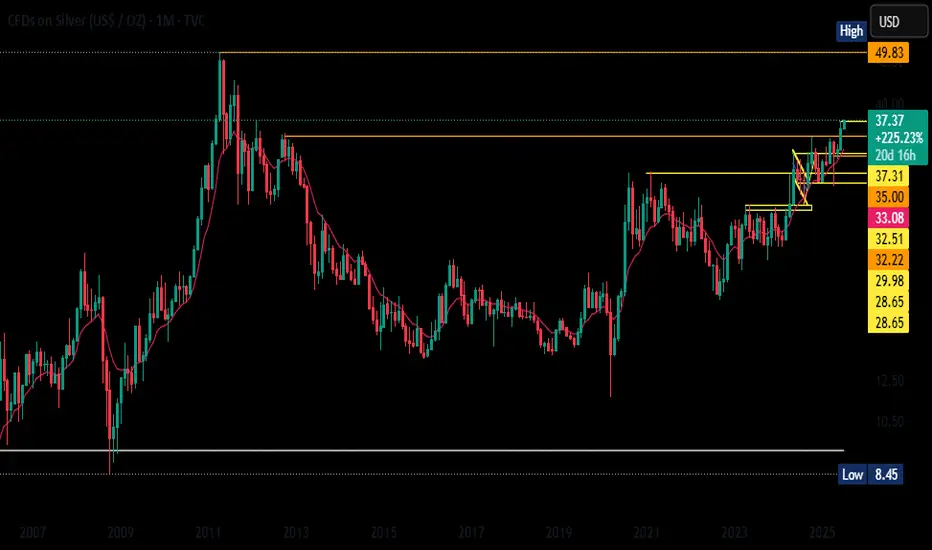
Look at the monthly chart of Silver (CFDs in USD/OZ), the longterm trend is clearly bullish. After spending over a decade consolidating below the $30–35 zone, The breakout above this historical resistance is significant and shows strong momentum, especially with price holding well above the 10-month EMA. We’re currently testing the $37.31 level, and if that gets taken out cleanly, the next major target is the all-time high at $49.83 from 2011. The recent structure even resembles a cup-and-handle or ascending triangle pattern, adding more weight to the bullish case. Support zones are now layered at $35, $33.06, and $32.51—key levels that were previous resistances. If there's any dip back to those zones, it may offer a solid buy-on-dips opportunity. As long as Silver holds above $35 on the monthly chart, I stay bullish with eyes on a move toward the $49.83 zone.
免责声明
这些信息和出版物并不意味着也不构成TradingView提供或认可的金融、投资、交易或其它类型的建议或背书。请在使用条款阅读更多信息。
免责声明
这些信息和出版物并不意味着也不构成TradingView提供或认可的金融、投资、交易或其它类型的建议或背书。请在使用条款阅读更多信息。