📊 SJS Trade Plan Summary
🔹 Multi-Timeframe Analysis
Yearly Demand: 742 – 376 (Avg 559) → UP Trend
6 Month Demand: 828 – 549 (Avg 689) → UP
Quarterly Demand: 828 – 760 (Avg 794) → UP
Monthly Demand: 1061 – 820 (Avg 941) → UP
Weekly Demand: 1217 – 1135 (Avg 1176) → UP
Daily Demand: 1217 – 1135 (Avg 1176) → UP
Intraday TF Demand (60M / 180M / 240M): 1187 – 1135 → Strong UP
✅ Overall Bias: Consistent bullish alignment across all MTF & ITF → Strong Buy Setup.
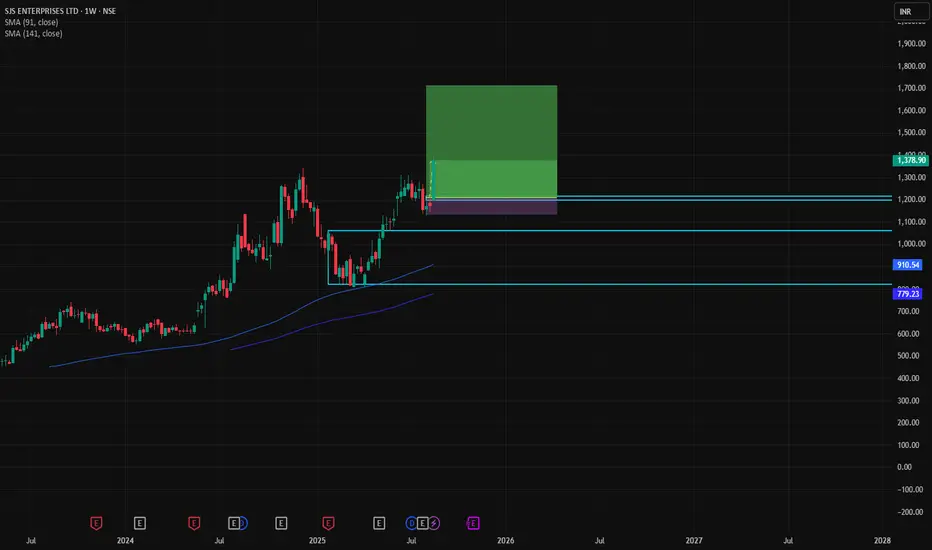
🔹 Trade Plan
Entry: 1217
Stop Loss (SL): 1135
Risk per Share: 82
Target: 1742
Reward per Share: 525
RR: 6.40
🔹 Position Sizing & Capital
Qty: 1000 shares
Total Buy Value: ₹12,17,000
Capital Required (40% Margin): ₹4,86,800
Brokerage & Charges (~0.49%): ₹5,966
🔹 P&L Outcome
If Target Hit:
Gross Profit = ₹5,25,000
Net Profit after costs = ₹5,19,034
ROI (on margin capital, pre-interest) = 106%
If SL Hit:
Gross Loss = ₹82,000
Net Loss after costs = ₹87,966
➡️ Net RR: ~5.9 : 1 (Excellent).
🔹 MTF Interest Impact (4 months @ 9.69% p.a.)
Capital Funded (MTF 60%): ₹7,30,200
Total Interest (4 months): ₹23,262
Adjusted Net Profit After Interest: ₹4,95,772
Real ROI (on 4.86L margin in 4 months): ~102%
✅ SJS Final Takeaway
Strongest bullish alignment across all TFs (Yearly → Daily → Intraday).
Attractive RR ~6 with potential 100% ROI in 4 months (leveraged MTF).
Risk very well defined (₹88K vs ₹5.2L reward).
Works beautifully as a high conviction trade in your portfolio, similar to Bajaj Finance plan.
🔹 Multi-Timeframe Analysis
Yearly Demand: 742 – 376 (Avg 559) → UP Trend
6 Month Demand: 828 – 549 (Avg 689) → UP
Quarterly Demand: 828 – 760 (Avg 794) → UP
Monthly Demand: 1061 – 820 (Avg 941) → UP
Weekly Demand: 1217 – 1135 (Avg 1176) → UP
Daily Demand: 1217 – 1135 (Avg 1176) → UP
Intraday TF Demand (60M / 180M / 240M): 1187 – 1135 → Strong UP
✅ Overall Bias: Consistent bullish alignment across all MTF & ITF → Strong Buy Setup.
🔹 Trade Plan
Entry: 1217
Stop Loss (SL): 1135
Risk per Share: 82
Target: 1742
Reward per Share: 525
RR: 6.40
🔹 Position Sizing & Capital
Qty: 1000 shares
Total Buy Value: ₹12,17,000
Capital Required (40% Margin): ₹4,86,800
Brokerage & Charges (~0.49%): ₹5,966
🔹 P&L Outcome
If Target Hit:
Gross Profit = ₹5,25,000
Net Profit after costs = ₹5,19,034
ROI (on margin capital, pre-interest) = 106%
If SL Hit:
Gross Loss = ₹82,000
Net Loss after costs = ₹87,966
➡️ Net RR: ~5.9 : 1 (Excellent).
🔹 MTF Interest Impact (4 months @ 9.69% p.a.)
Capital Funded (MTF 60%): ₹7,30,200
Total Interest (4 months): ₹23,262
Adjusted Net Profit After Interest: ₹4,95,772
Real ROI (on 4.86L margin in 4 months): ~102%
✅ SJS Final Takeaway
Strongest bullish alignment across all TFs (Yearly → Daily → Intraday).
Attractive RR ~6 with potential 100% ROI in 4 months (leveraged MTF).
Risk very well defined (₹88K vs ₹5.2L reward).
Works beautifully as a high conviction trade in your portfolio, similar to Bajaj Finance plan.
免责声明
这些信息和出版物并非旨在提供,也不构成TradingView提供或认可的任何形式的财务、投资、交易或其他类型的建议或推荐。请阅读使用条款了解更多信息。