First off, SMPH is a bluechip stock in PSE.
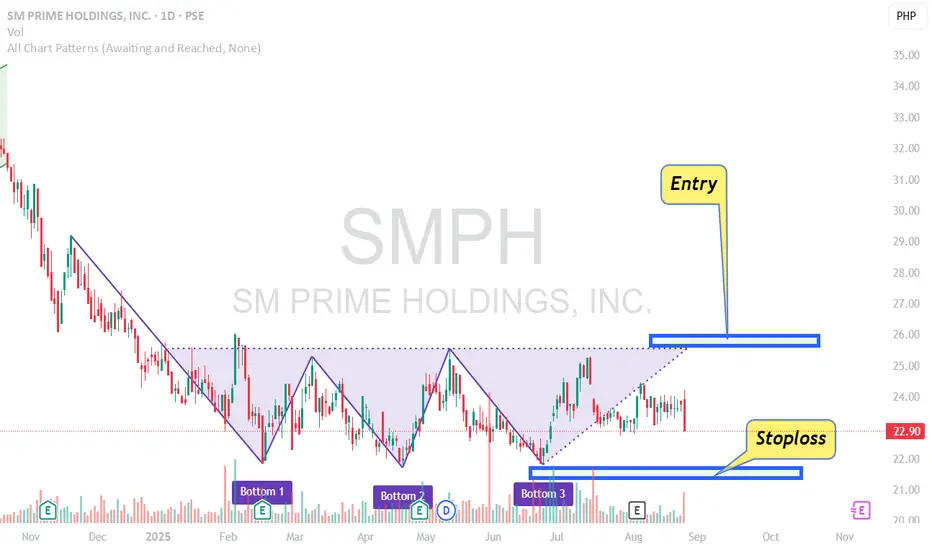
The price of SMPH made a triple bottom chart pattern. Triple bottom is a bullish reversal pattern. The entry is on the break of the neckline. You put a stoploss below the right (3rd) shoulder after entry.
Triple bottom chart pattern is a "prove me your strong by breaking out" type of pattern. Most traders confuse triple bottom as a pattern to buy near the bottom. You do not buy near the bottom on this type of pattern. You buy on breakouts. Any chart pattern can either succeed or fail. Near bottom buying is a step closer to the chart pattern failing so avoid that. Calm yourself down and wait for the breakout.
BER months is coming and that might trigger some movement on this stock.
Goodluck on your trades. Trade well.
Traders Den PH
blogs.tradersdenph.com
blogs.tradersdenph.com
免责声明
这些信息和出版物并非旨在提供,也不构成TradingView提供或认可的任何形式的财务、投资、交易或其他类型的建议或推荐。请阅读使用条款了解更多信息。
Traders Den PH
blogs.tradersdenph.com
blogs.tradersdenph.com
免责声明
这些信息和出版物并非旨在提供,也不构成TradingView提供或认可的任何形式的财务、投资、交易或其他类型的建议或推荐。请阅读使用条款了解更多信息。