hi Traders
Let's have a look at SNAP stock.
It gets a lot of hate recently, but chart looks good for a bullish reversal.
📊 Chart Overview
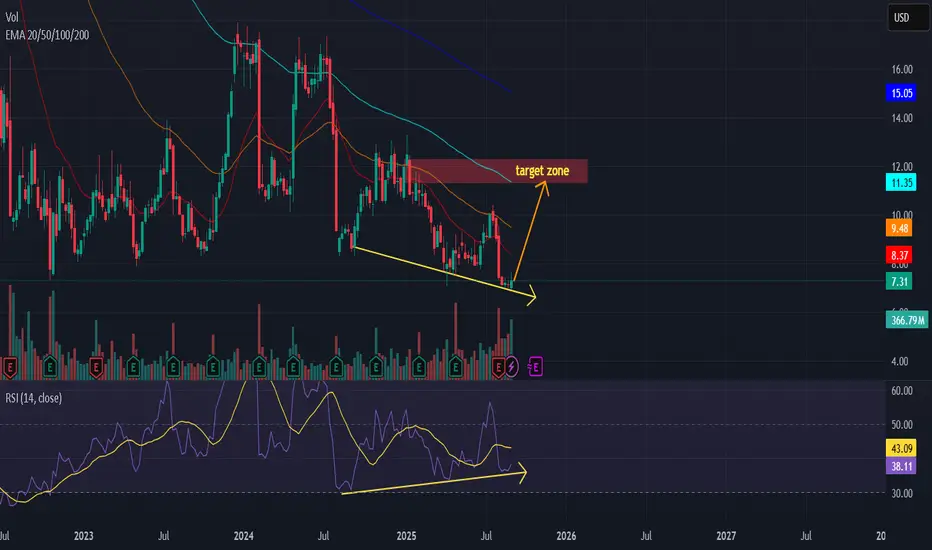
Current Price: $7.31
EMAs in play: 20 EMA ($8.37), 50 EMA ($9.48), 100 EMA ($11.35), 200 EMA ($15.05)
Volume: ~366.8M
🔎 Technical Analysis
Falling Wedge Structure
Price has been making lower lows but within a narrowing falling wedge pattern.
The wedge is approaching the support trendline, suggesting potential for a breakout.
Bullish Divergences (RSI)
RSI has formed higher lows, while price made lower lows.
This is a classic bullish divergence, hinting at weakening bearish momentum.
Volume Pickup
Recent green volume spikes suggest accumulation near the bottom support zone.
🎯 Target Zone
First target: $9.50 (50 EMA resistance).
Extended target: $11.35 – $12.00 (100 EMA + strong supply zone).
⚠️ Risk Management
Stop-loss: Below $6.80 (recent swing low, wedge support).
Risk/Reward Ratio: ~1:2.5 if aiming for $11–12 zone.
I personally won't sell below 11.
📈 Trading Idea
SNAP is showing signs of a potential bullish reversal on the 3-day timeframe. The combination of a falling wedge, bullish RSI divergence, and increasing volume supports a bounce toward higher resistance zones. A sustained break above the 20 & 50 EMAs could trigger momentum toward the $11–12 target zone.
Let's have a look at SNAP stock.
It gets a lot of hate recently, but chart looks good for a bullish reversal.
📊 Chart Overview
Current Price: $7.31
EMAs in play: 20 EMA ($8.37), 50 EMA ($9.48), 100 EMA ($11.35), 200 EMA ($15.05)
Volume: ~366.8M
🔎 Technical Analysis
Falling Wedge Structure
Price has been making lower lows but within a narrowing falling wedge pattern.
The wedge is approaching the support trendline, suggesting potential for a breakout.
Bullish Divergences (RSI)
RSI has formed higher lows, while price made lower lows.
This is a classic bullish divergence, hinting at weakening bearish momentum.
Volume Pickup
Recent green volume spikes suggest accumulation near the bottom support zone.
🎯 Target Zone
First target: $9.50 (50 EMA resistance).
Extended target: $11.35 – $12.00 (100 EMA + strong supply zone).
⚠️ Risk Management
Stop-loss: Below $6.80 (recent swing low, wedge support).
Risk/Reward Ratio: ~1:2.5 if aiming for $11–12 zone.
I personally won't sell below 11.
📈 Trading Idea
SNAP is showing signs of a potential bullish reversal on the 3-day timeframe. The combination of a falling wedge, bullish RSI divergence, and increasing volume supports a bounce toward higher resistance zones. A sustained break above the 20 & 50 EMAs could trigger momentum toward the $11–12 target zone.
💥 Free signals and ideas ➡ t.me/vfinvestment
免责声明
这些信息和出版物并不意味着也不构成TradingView提供或认可的金融、投资、交易或其它类型的建议或背书。请在使用条款阅读更多信息。
💥 Free signals and ideas ➡ t.me/vfinvestment
免责声明
这些信息和出版物并不意味着也不构成TradingView提供或认可的金融、投资、交易或其它类型的建议或背书。请在使用条款阅读更多信息。