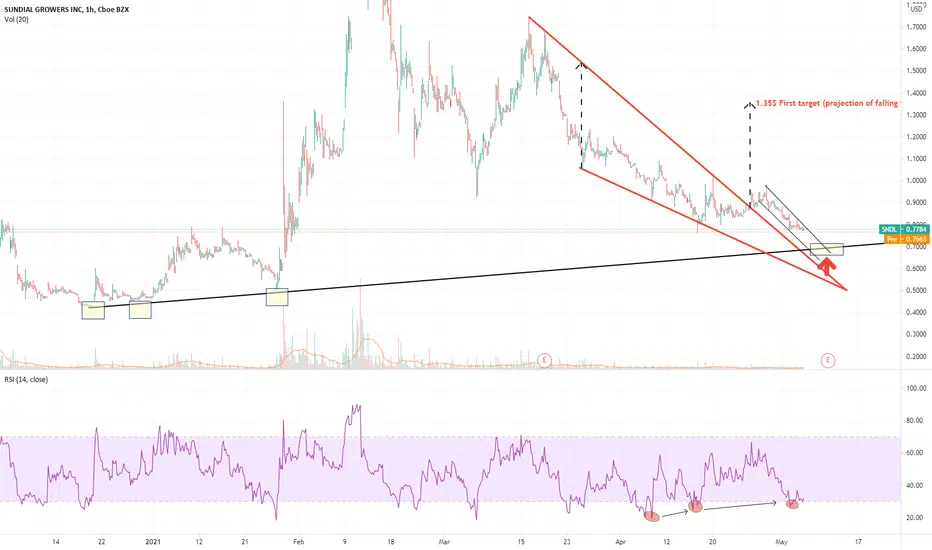
#SNDL is in my opinion very close to reverse the downtrend. Possible rebounce area at 0.7$, if not happening before. The one hour chart is showing a falling wedge being broken - with volumes - on April 27th and the price is now retracing looking for a pullback.
Very interesting to see how this bullish wedge pattern is also supported by an RSI divergence: so, basically, the RSI shows higher lows, while the prices are showing lower lows. This is pretty indicative of the fact that sellers are loosing momentum. The target of the falling wedge stands at 1.35$, but I am pretty convinced that once we reach the 1.3$ again, we'll not be seeing the bottom under 1$ anymore.
Very interesting to see how this bullish wedge pattern is also supported by an RSI divergence: so, basically, the RSI shows higher lows, while the prices are showing lower lows. This is pretty indicative of the fact that sellers are loosing momentum. The target of the falling wedge stands at 1.35$, but I am pretty convinced that once we reach the 1.3$ again, we'll not be seeing the bottom under 1$ anymore.
交易开始
The price is still at 0.7$ level, as expected. Strng support here coming from different trendlines. Moreover, RSI is confirmed to be divergent, and this is especially true in the H4 timeframe, where we are just coming out from oversold territory for the third time since April 16thOpero sui mercati finanziari dal 2010 con approccio prevalentemente tecnico. Investitore Palantir dal 2022 e Analista Tecnico Certificato SIAT. Specializzato nel mercato azionario US e IT.
免责声明
这些信息和出版物并非旨在提供,也不构成TradingView提供或认可的任何形式的财务、投资、交易或其他类型的建议或推荐。请阅读使用条款了解更多信息。
Opero sui mercati finanziari dal 2010 con approccio prevalentemente tecnico. Investitore Palantir dal 2022 e Analista Tecnico Certificato SIAT. Specializzato nel mercato azionario US e IT.
免责声明
这些信息和出版物并非旨在提供,也不构成TradingView提供或认可的任何形式的财务、投资、交易或其他类型的建议或推荐。请阅读使用条款了解更多信息。