Technical Analysis:
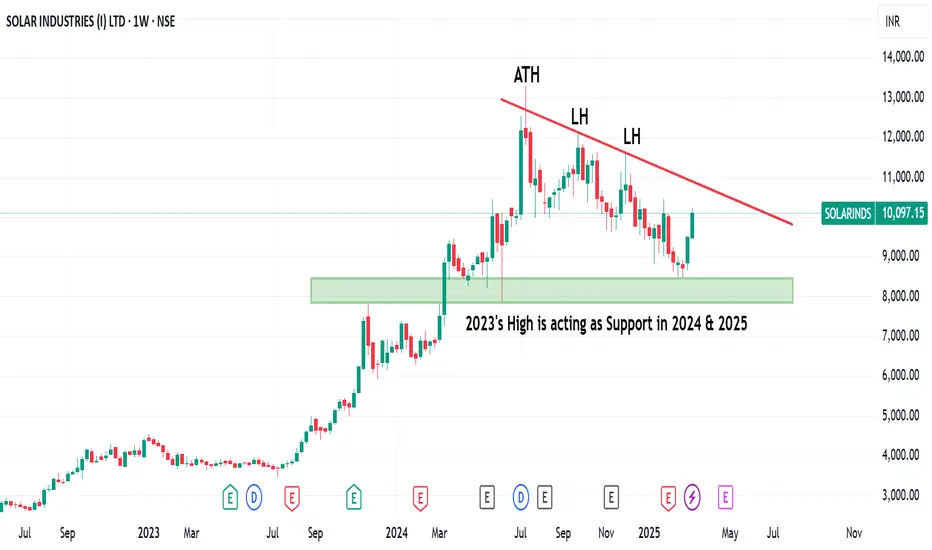
Solar Industries stock has exhibited massive bullish growth over the past decade, showing a consistent uptrend since 2009. In 2023, the stock reached a high of ₹7,833, which was later breached in March 2024. Interestingly, this level acted as a strong support multiple times in April, May, and June 2024.
After this support, the stock saw a steep rally to a new record high of ₹13,298. But from July 2024 to February 2025, the stock saw a steady fall, ultimately reaching a low where it was supported by its earlier 2023 high.
The recent spike from February 28, 2025, is due to good news that Solar Industries has bagged a large defense order of ₹2,150 crore from a foreign client, to be delivered in the next six years. Since then, the stock has witnessed good bullish strength, with two successive bullish weekly candles in the last two weeks.
Important levels to observe:
Resistance Levels:
Support Levels:
If the stock remains above ₹9,445 and manages to cross the resistance levels, it can continue its bullish trend to new highs.
Fundamental Analysis:
Solar Industries has come out with good Q3 FY24 financial numbers, demonstrating robust revenue growth and profitability. The major financial figures (in ₹ crore) are as under:
The overall income of the company increased by 46.5% QoQ from ₹1,347 crore in Q2 FY24 and 38% YoY from ₹1,429 crore in Q3 FY23. Profit before tax and profit after tax also showed good growth, which further confirms Solar Industries' good financial health and optimistic outlook.
Conclusion:
Solar Industries is showing solid bullish momentum, supported by positive news, technical breakout levels, and healthy financial performance. Investors need to keep an eye on the resistance levels to validate the next breakout, while also keeping in mind important support levels for risk management.
Disclaimer: This analysis is for educational purposes only. Investors are advised to do their own research before they make any trading decisions.
Solar Industries stock has exhibited massive bullish growth over the past decade, showing a consistent uptrend since 2009. In 2023, the stock reached a high of ₹7,833, which was later breached in March 2024. Interestingly, this level acted as a strong support multiple times in April, May, and June 2024.
After this support, the stock saw a steep rally to a new record high of ₹13,298. But from July 2024 to February 2025, the stock saw a steady fall, ultimately reaching a low where it was supported by its earlier 2023 high.
The recent spike from February 28, 2025, is due to good news that Solar Industries has bagged a large defense order of ₹2,150 crore from a foreign client, to be delivered in the next six years. Since then, the stock has witnessed good bullish strength, with two successive bullish weekly candles in the last two weeks.
Important levels to observe:
Resistance Levels:
- ₹10,440 (recent lower high)
- ₹11,597 (next lower high)
- ₹12,124 (key resistance)
- ₹13,298 (all-time high)
Support Levels:
- ₹7,800 - ₹8,500 (a robust demand zone that has acted as support several times in 2024 and 2025)
- Stop Loss: Weekly candle low of ₹9,445
If the stock remains above ₹9,445 and manages to cross the resistance levels, it can continue its bullish trend to new highs.
Fundamental Analysis:
Solar Industries has come out with good Q3 FY24 financial numbers, demonstrating robust revenue growth and profitability. The major financial figures (in ₹ crore) are as under:
- Total Income: ₹1,973 in Q3 FY24, ₹1,347 in Q2 FY24, ₹1,429 in Q3 FY23.
- Total Expenses: ₹1,494 in Q3 FY24, ₹1,045 in Q2 FY24, ₹1,112 in Q3 FY23.
- Total Operating Income: ₹479 in Q3 FY24, ₹302 in Q2 FY24, ₹317 in Q3 FY23.
- Profit Before Tax: ₹459 in Q3 FY24, ₹285 in Q2 FY24, ₹299 in Q3 FY23.
- Profit After Tax: ₹315 in Q3 FY24, ₹200 in Q2 FY24, ₹203 in Q3 FY23.
- Diluted Normalized EPS: ₹35 in Q3 FY24, ₹22 in Q2 FY24, ₹22 in Q3 FY23.
The overall income of the company increased by 46.5% QoQ from ₹1,347 crore in Q2 FY24 and 38% YoY from ₹1,429 crore in Q3 FY23. Profit before tax and profit after tax also showed good growth, which further confirms Solar Industries' good financial health and optimistic outlook.
Conclusion:
Solar Industries is showing solid bullish momentum, supported by positive news, technical breakout levels, and healthy financial performance. Investors need to keep an eye on the resistance levels to validate the next breakout, while also keeping in mind important support levels for risk management.
Disclaimer: This analysis is for educational purposes only. Investors are advised to do their own research before they make any trading decisions.
免责声明
这些信息和出版物并不意味着也不构成TradingView提供或认可的金融、投资、交易或其它类型的建议或背书。请在使用条款阅读更多信息。
免责声明
这些信息和出版物并不意味着也不构成TradingView提供或认可的金融、投资、交易或其它类型的建议或背书。请在使用条款阅读更多信息。