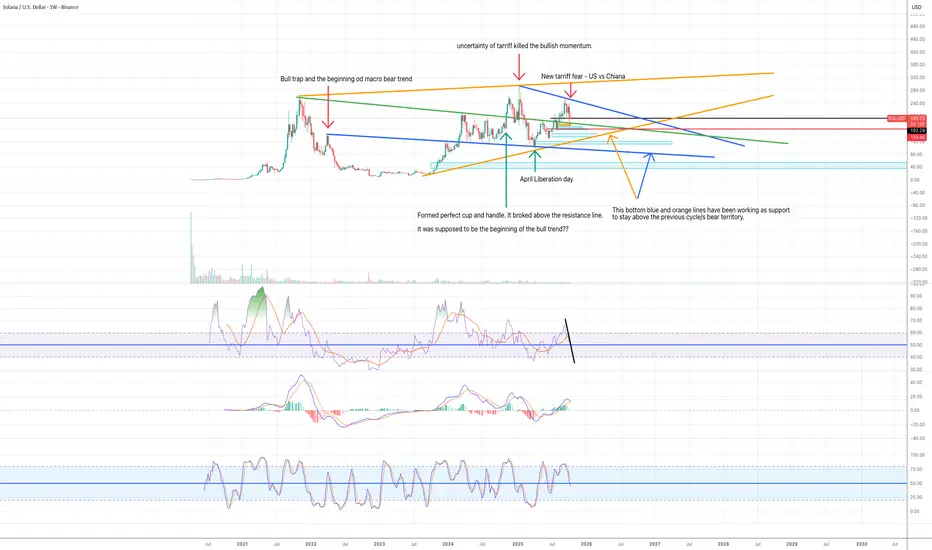
I can see a few patterns in a weekly chart.
1) The price is moving inside the blue descending wedge pattern.
2) The price is moving inside the orange ascending wedge pattern.
3) Green descending support/resistance line is the line that completes a huge cup and handle pattern.
What do you think? I would like to know what others see.
Have a nice weekend.
相关出版物
免责声明
这些信息和出版物并非旨在提供,也不构成TradingView提供或认可的任何形式的财务、投资、交易或其他类型的建议或推荐。请阅读使用条款了解更多信息。