Since the April lows across both equities and crypto markets,  SOL has been one of the standout performers, printing a powerful bullish trend structure defined by two major bull flags — each followed by significant measured-move extensions.
Phase 1 – The First Bull Flag
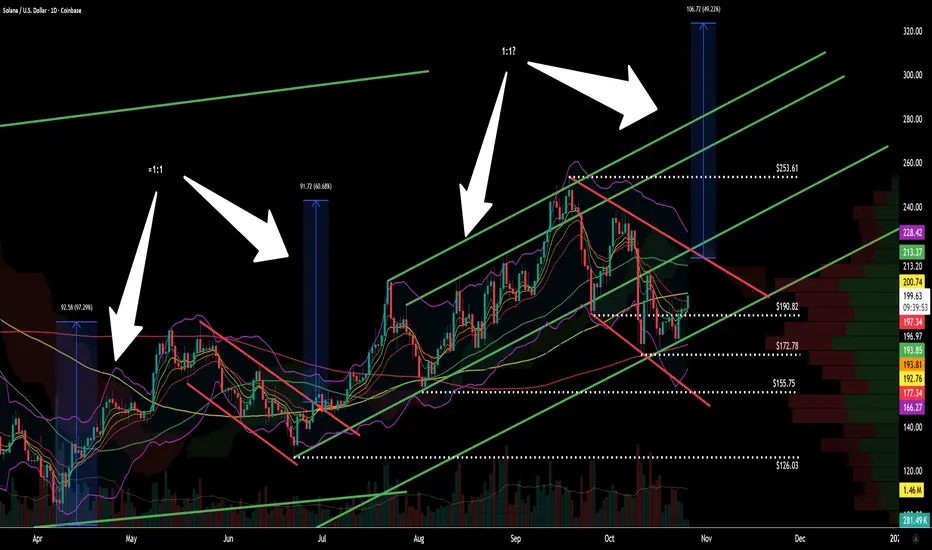
The first rally delivered a 97% gain, followed by a 30% retracement, forming a textbook flag structure.
After a clean breakout and retest of the upper trendline in late June, Solana launched into a 60% measured move, aligning closely with a ≈1:1 projection of the initial flagpole.
This breakout confirmed strong underlying momentum, accompanied by increasing volume and trend confirmation across the broader crypto space.
Phase 2 – The Second Flag Formation
The breakout from the first flag initiated a second 100% run, moving from $126-$253, before undergoing another 30% retracement down to $172.
This pullback mirrors the previous structure almost perfectly, consolidating within another bull flag as the market digests gains.
Currently, price is holding above $190, sitting just beneath the upper flag boundary. The consolidation remains healthy, and if momentum continues to build within this pattern, a volume-backed breakout could lead to a retest of the upper trendline and continuation toward higher levels.
Trend Channel & Structure
The broader move from early June forms a dual-trendline bull channel, where both sets of parallel trendlines are aligned near a 45° slope. This structure reinforces the bullish bias, showing consistent rhythm between impulses and corrections — a strong sign of a well-organized uptrend rather than random volatility.
The pattern also shows proportional price swings, with both measured moves (~1:1) maintaining the same amplitude, suggesting institutional order flow and algorithmic consistency.
Key Levels to Watch
Level Significance
$253.61 Flag target & prior swing high
$213–$214 Local resistance cluster
$190.82 Current support zone (holding above)
$172.78 30% retrace support
$155.75 / $126.03 Structural supports / prior flag bases
A confirmed close above $213–$214 on rising volume would be the first signal that the breakout is underway. Failure to hold $190 would risk extending the flag lower toward the $172 zone.
Measured Move & Projection
If the breakout mirrors the first flag’s performance, a measured move equal to the previous flagpole projects a potential target near $323 — aligning with the upper bound of the extended bull channel.
That projection maintains symmetry with previous rally amplitudes (97%, 60%, ~100%), further validating the trend continuation scenario.
Technical Summary
✅ Trend: Bullish (higher highs & higher lows)
✅ Pattern: Dual bull flags within rising parallel channel
📊 Momentum: Strong; price holding above 8/13 EMA cluster
⚙️ Support: $190 → $172 → $155
🎯 Target: $323 (1:1 projection from current flagpole)
🔍 Trigger: Breakout above top trendline on increased volume
Final Notes
SOL remains technically one of the strongest large-cap crypto charts — clean structure, repeatable patterns, and consistent retracement depth between impulsive legs.
While short-term volatility is expected inside the flag, the 45° upward channel and consistent measured-move behavior keep the medium-term bias bullish through Q4.
As always, volume confirmation will be key, a breakout supported by expanding participation could mark the start of the next leg toward $323.
For educational and technical analysis purposes only.
Phase 1 – The First Bull Flag
The first rally delivered a 97% gain, followed by a 30% retracement, forming a textbook flag structure.
After a clean breakout and retest of the upper trendline in late June, Solana launched into a 60% measured move, aligning closely with a ≈1:1 projection of the initial flagpole.
This breakout confirmed strong underlying momentum, accompanied by increasing volume and trend confirmation across the broader crypto space.
Phase 2 – The Second Flag Formation
The breakout from the first flag initiated a second 100% run, moving from $126-$253, before undergoing another 30% retracement down to $172.
This pullback mirrors the previous structure almost perfectly, consolidating within another bull flag as the market digests gains.
Currently, price is holding above $190, sitting just beneath the upper flag boundary. The consolidation remains healthy, and if momentum continues to build within this pattern, a volume-backed breakout could lead to a retest of the upper trendline and continuation toward higher levels.
Trend Channel & Structure
The broader move from early June forms a dual-trendline bull channel, where both sets of parallel trendlines are aligned near a 45° slope. This structure reinforces the bullish bias, showing consistent rhythm between impulses and corrections — a strong sign of a well-organized uptrend rather than random volatility.
The pattern also shows proportional price swings, with both measured moves (~1:1) maintaining the same amplitude, suggesting institutional order flow and algorithmic consistency.
Key Levels to Watch
Level Significance
$253.61 Flag target & prior swing high
$213–$214 Local resistance cluster
$190.82 Current support zone (holding above)
$172.78 30% retrace support
$155.75 / $126.03 Structural supports / prior flag bases
A confirmed close above $213–$214 on rising volume would be the first signal that the breakout is underway. Failure to hold $190 would risk extending the flag lower toward the $172 zone.
Measured Move & Projection
If the breakout mirrors the first flag’s performance, a measured move equal to the previous flagpole projects a potential target near $323 — aligning with the upper bound of the extended bull channel.
That projection maintains symmetry with previous rally amplitudes (97%, 60%, ~100%), further validating the trend continuation scenario.
Technical Summary
✅ Trend: Bullish (higher highs & higher lows)
✅ Pattern: Dual bull flags within rising parallel channel
📊 Momentum: Strong; price holding above 8/13 EMA cluster
⚙️ Support: $190 → $172 → $155
🎯 Target: $323 (1:1 projection from current flagpole)
🔍 Trigger: Breakout above top trendline on increased volume
Final Notes
While short-term volatility is expected inside the flag, the 45° upward channel and consistent measured-move behavior keep the medium-term bias bullish through Q4.
As always, volume confirmation will be key, a breakout supported by expanding participation could mark the start of the next leg toward $323.
For educational and technical analysis purposes only.
免责声明
这些信息和出版物并非旨在提供,也不构成TradingView提供或认可的任何形式的财务、投资、交易或其他类型的建议或推荐。请阅读使用条款了解更多信息。