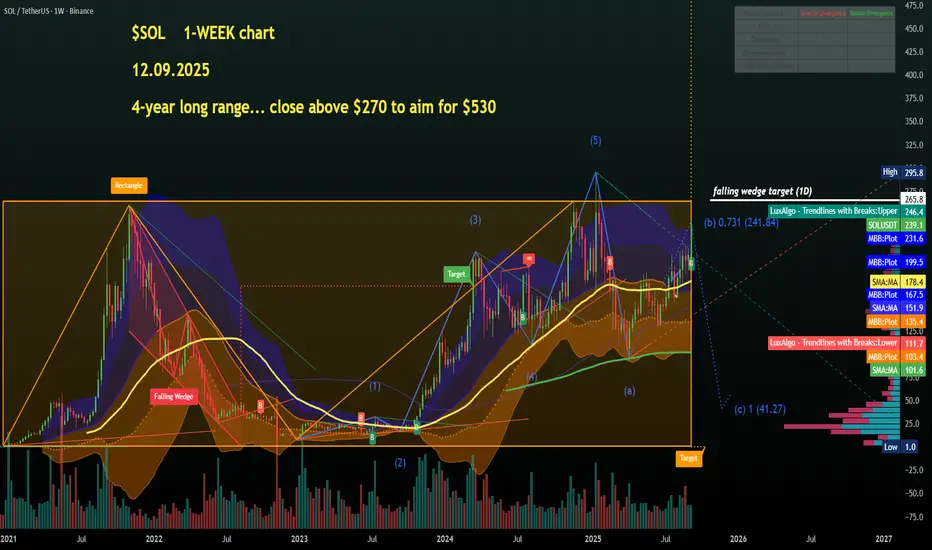
So, first of all a huge range since the beginning of 2021, let's call that a rectangle pattern giving us a clear long-term breakout level on weekly candle close above $265-$275, the higher the better.
RSI upcurved nicely at 66 so plenty of room to grow in Q4.
From there we would have a target of around $525, not unrealistic. Daily view next💙👽☝️
免责声明
这些信息和出版物并不意味着也不构成TradingView提供或认可的金融、投资、交易或其它类型的建议或背书。请在使用条款阅读更多信息。
免责声明
这些信息和出版物并不意味着也不构成TradingView提供或认可的金融、投资、交易或其它类型的建议或背书。请在使用条款阅读更多信息。