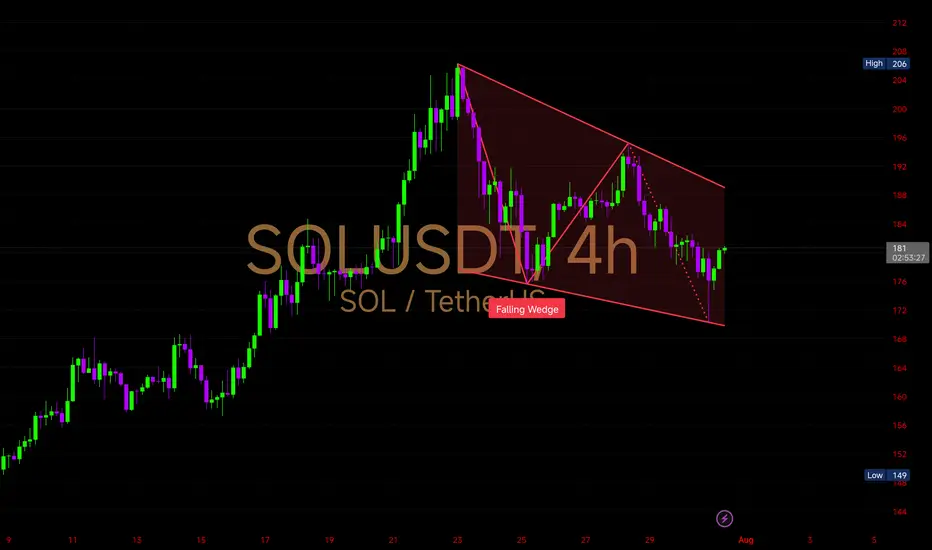
• Falling Wedge, sloping downward with converging trendlines
• Price has respected both upper and lower bounds of the wedge with multiple touches
• SOLANA corrected from a high of $206 down to the wedge’s base near $174-$176
Latest candle shows buying pressure at the wedge support, hinting at a potential bounce
Support Zone: $174 → $176 (bottom of the wedge)
Resistance to Watch: $184 (upper wedge line), followed by breakout level at $188
Breakout Confirmation: Clean close above $188 on solid volume
📈 Probable Scenarios:
Bullish: Breakout from the wedge could lead to a move back toward $195-$200
Bearish: Rejection at upper wedge line could push price back to test $174 again
Wedge formations after extended rallies often act as bullish continuation patterns. If momentum picks up,
免责声明
这些信息和出版物并非旨在提供,也不构成TradingView提供或认可的任何形式的财务、投资、交易或其他类型的建议或推荐。请阅读使用条款了解更多信息。
免责声明
这些信息和出版物并非旨在提供,也不构成TradingView提供或认可的任何形式的财务、投资、交易或其他类型的建议或推荐。请阅读使用条款了解更多信息。