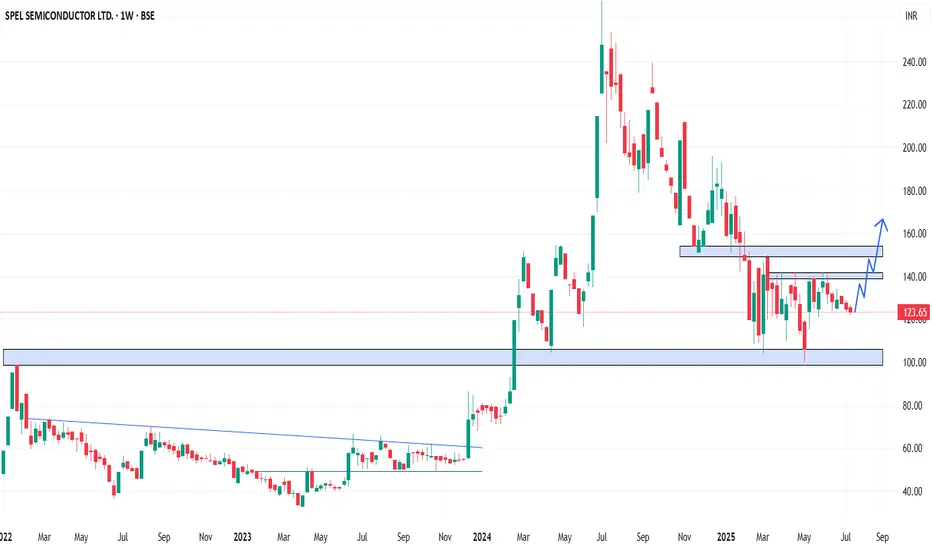
In the Weekly Chart of SPELS ,
we can see that, it took a bounce back from 100 level
Also, after rejection at 140 levels, the selling is not strong.
We can see a up move from here.
Expected momentum is shown in chart.
we can see that, it took a bounce back from 100 level
Also, after rejection at 140 levels, the selling is not strong.
We can see a up move from here.
Expected momentum is shown in chart.
免责声明
这些信息和出版物并非旨在提供,也不构成TradingView提供或认可的任何形式的财务、投资、交易或其他类型的建议或推荐。请阅读使用条款了解更多信息。
免责声明
这些信息和出版物并非旨在提供,也不构成TradingView提供或认可的任何形式的财务、投资、交易或其他类型的建议或推荐。请阅读使用条款了解更多信息。