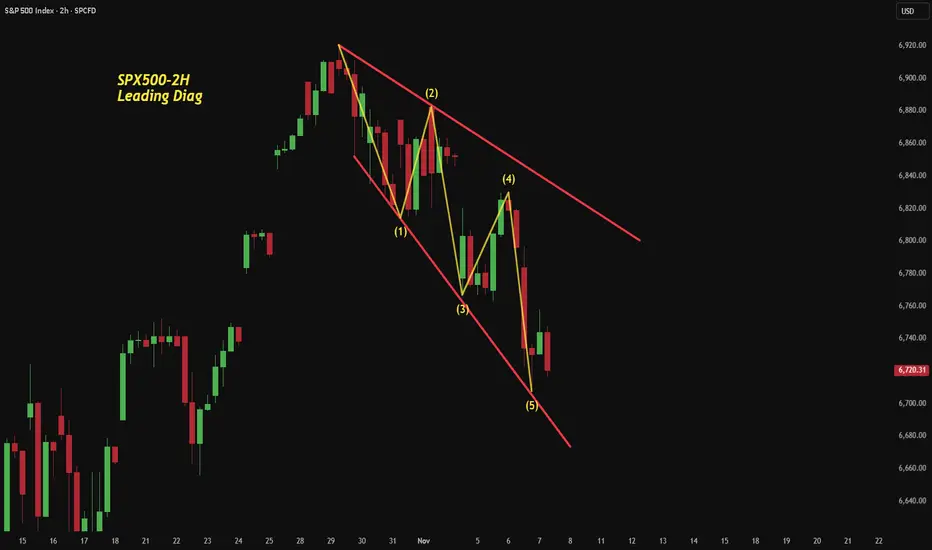
The S&P 500’s 2-hour chart may have just carved a leading diagonal right off the all-time high — a structure often seen at the start of a major new trend.
Each leg fits the contracting wedge geometry:
Wave (1) and (4) overlap, Wave (5) throws slightly under the boundary, and momentum stays fierce through the end — almost too fierce for comfort.
What makes this one interesting is the absence of RSI divergence at the final leg.
That raises the question — is Wave (1) really done, or does it have one last flush before a sharp Wave (2) retracement begins?
For now, watch how price reacts around the 6,760–6,800 zone.
A strong recovery through 0.618–0.786 of the drop would confirm the diagonal and set up a critical test of the broader bearish sequence.
Disclaimer: This analysis is for educational purposes only and does not constitute investment advice. Please do your own research (DYOR) before making any trading decisions.
WaveXplorer | Elliott Wave insights
📊 X profile: @veerappa89
📊 X profile: @veerappa89
免责声明
这些信息和出版物并非旨在提供,也不构成TradingView提供或认可的任何形式的财务、投资、交易或其他类型的建议或推荐。请阅读使用条款了解更多信息。
WaveXplorer | Elliott Wave insights
📊 X profile: @veerappa89
📊 X profile: @veerappa89
免责声明
这些信息和出版物并非旨在提供,也不构成TradingView提供或认可的任何形式的财务、投资、交易或其他类型的建议或推荐。请阅读使用条款了解更多信息。