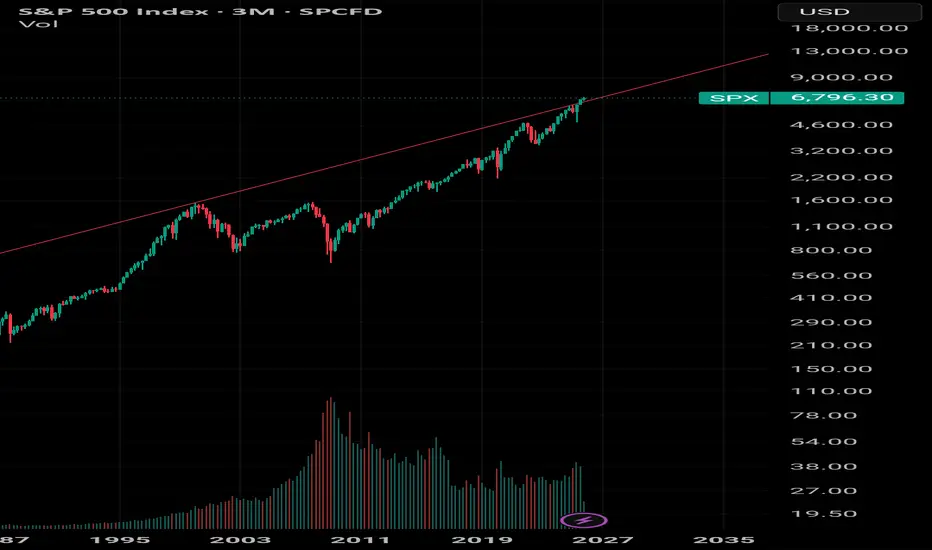
I love going back to this chart which tells us everything we need to know when asking the question why is buffet sitting in so much cash. It's an amazing chart and you can see what will Happen, what needs to happen but not when. Needless to say we are still above the red line.
免责声明
这些信息和出版物并非旨在提供,也不构成TradingView提供或认可的任何形式的财务、投资、交易或其他类型的建议或推荐。请阅读使用条款了解更多信息。
免责声明
这些信息和出版物并非旨在提供,也不构成TradingView提供或认可的任何形式的财务、投资、交易或其他类型的建议或推荐。请阅读使用条款了解更多信息。