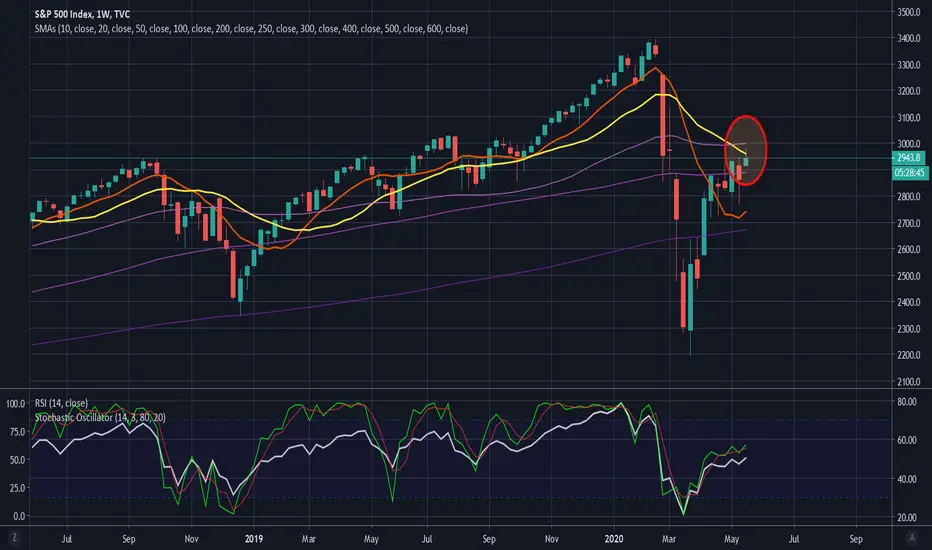
Watch this S&P 500 chart, and daily, for a broader perspective of whether stocks may start heading lower in the next week or two or continue rising. You can also check daily or 60min RSI and candle patterns.
免责声明
这些信息和出版物并不意味着也不构成TradingView提供或认可的金融、投资、交易或其它类型的建议或背书。请在使用条款阅读更多信息。
免责声明
这些信息和出版物并不意味着也不构成TradingView提供或认可的金融、投资、交易或其它类型的建议或背书。请在使用条款阅读更多信息。