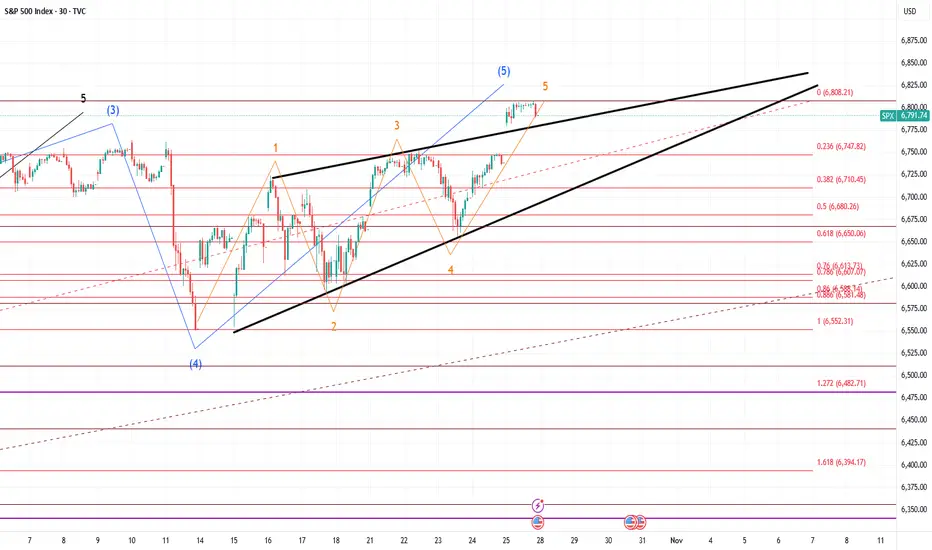
The ending diagonal has formed. If you check RSI you will see a double daily and fresh WEEKLY divergence. It will crash hard next week. 6480 is the first target, but it can be just a bounce area. 1.618 level from low to top of the diagonal is at 6400 level on SPX and at 6300 level on US500 - I think we can get a flash-crash into this area next week. And if this is a reversal, it can trend down to February peak and lower according to fibs.
注释
Divergences
注释
Maybe it's still wave 3, so I have published an idea on Nasdaq which suggests it can take a little more time. So if it goes above 6814 the ending diagonal won't be invalidated.
注释
Still think it's an ending diagonal. But the target is higher now (6650 area).
交易手动结束
6650 reached. Can still go a little bit lower, but if my expanding ending diagonal idea is correct, the next wave up will be bigger than previous one and will take more than a month.免责声明
这些信息和出版物并非旨在提供,也不构成TradingView提供或认可的任何形式的财务、投资、交易或其他类型的建议或推荐。请阅读使用条款了解更多信息。
免责声明
这些信息和出版物并非旨在提供,也不构成TradingView提供或认可的任何形式的财务、投资、交易或其他类型的建议或推荐。请阅读使用条款了解更多信息。